Free Newsletter

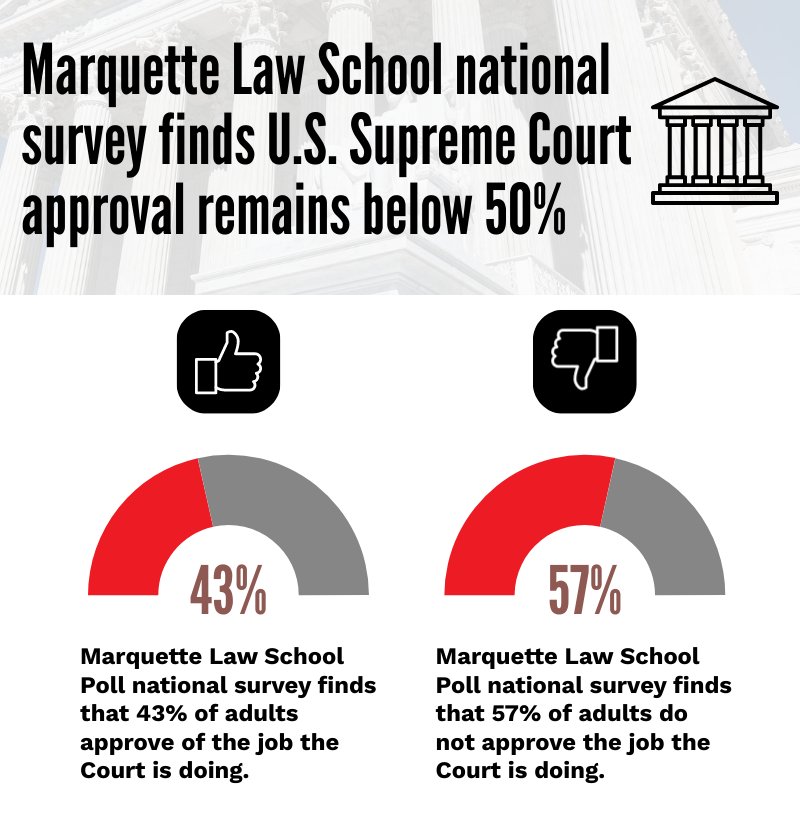
Marquette Law School national survey finds U.S. Supreme Court approval remains below 50%
WISCONSIN LAW JOURNAL STAFF//October 5, 2023//
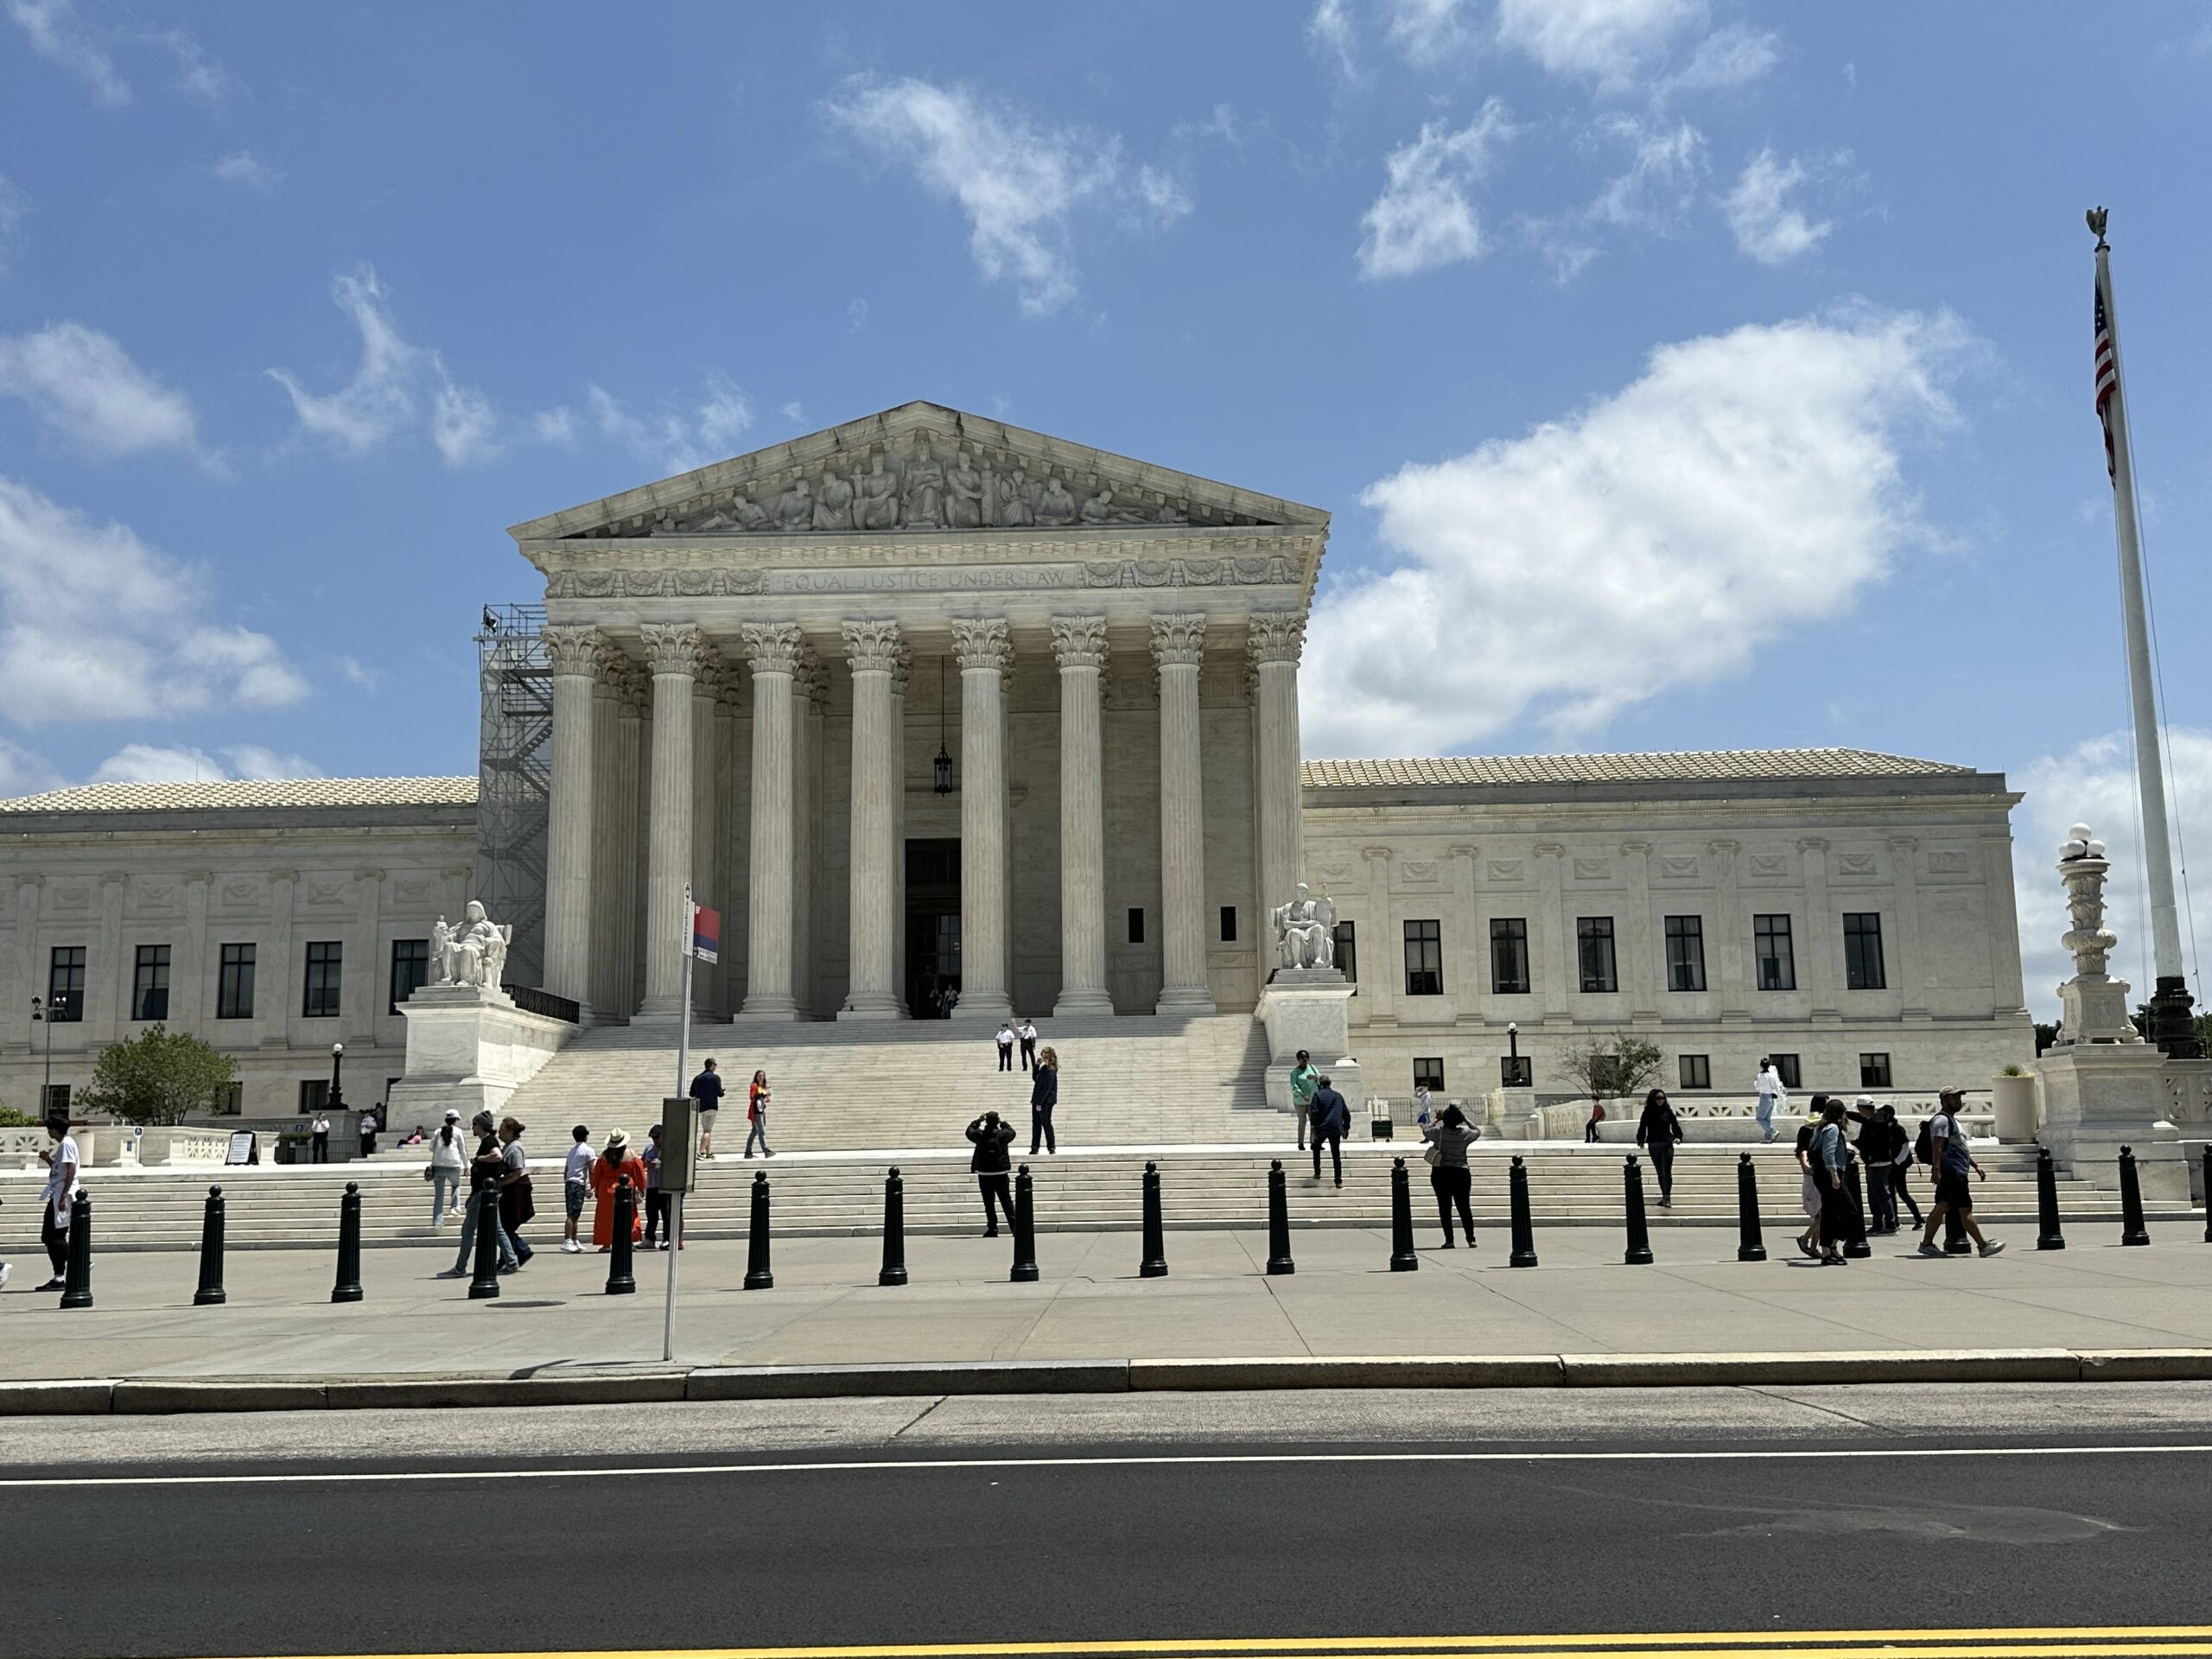
U.S. Supreme Court Staff Photo by Steve Schuster
Marquette Law School national survey finds U.S. Supreme Court approval remains below 50%
WISCONSIN LAW JOURNAL STAFF//October 5, 2023//


As the U.S. Supreme Court begins its October 2023 term, a new Marquette Law School Poll national survey finds that 43% of adults approve of the job the Court is doing, while 57% disapprove. In the previous survey in July, 45% approved and 55% disapproved. Approval of the Court has remained below 50% since May 2022, when it stood at 44%. While approval is up from the low point of 38% in July 2022, it has fluctuated in the 40s percent range since then.
The trend in approval since 2020 is shown in Figure 1 and Table 1. (All results in the tables are stated as percentages; the precise wording of the questions can be found in the online link noted above.)
Table 1: Approval of Supreme Court‘s job performance
Among adults
| Poll dates | Approval | |
| Approve | Disapprove | |
| 9/18-25/23 | 43 | 57 |
| 7/7-12/23 | 45 | 55 |
| 5/8-18/23 | 41 | 59 |
| 3/13-22/23 | 44 | 56 |
| 1/9-20/23 | 47 | 53 |
| 11/15-22/22 | 44 | 56 |
| 9/7-14/22 | 40 | 60 |
| 7/5-12/22 | 38 | 61 |
| 5/9-19/22 | 44 | 55 |
| 3/14-24/22 | 54 | 45 |
| 1/10-21/22 | 52 | 46 |
| 11/1-10/21 | 54 | 46 |
| 9/7-16/21 | 49 | 50 |
| 7/16-26/21 | 60 | 39 |
| 9/8-15/20 | 66 | 33 |
| Marquette Law School Poll, national surveys | ||
| Question: Overall, how much do you approve or disapprove of the way the U.S. Supreme Court is handling its job? | ||
The latest Marquette Law School Poll’s national Supreme Court survey was conducted Sept. 18-25, 2023. The survey interviewed 1,007 adults nationwide and has a margin of error of +/-4.1 percentage points.
Partisan and ideological views of the Court and recent decisions
Approval among Republicans declined by 3 percentage points, to 66% in September, down from 69% in July. Approval among independents declined 7 percentage points, while among Democrats it rose 1 percentage point from July to September. Approval of the Court by party identification is shown in Table 2 for July and September. (Throughout this report, party identification includes independents who say they are closer to a party, while independents are those who say they are not closer to either party.)
Table 2: Approval of the Supreme Court’s job performance, with party identification, July and September 2023
Among adults
| Party ID | Approval | |
| Approve | Disapprove | |
| Sept. 2023 | ||
| Total | 43 | 57 |
| Republican | 66 | 34 |
| Independent | 33 | 67 |
| Democrat | 24 | 76 |
| July 2023 | ||
| Total | 45 | 55 |
| Republican | 69 | 31 |
| Independent | 40 | 59 |
| Democrat | 23 | 77 |
| Marquette Law School Poll, national surveys, July 7-12, 2023 & Sept. 18-25, 2023 | ||
| Question: Overall, how much do you approve or disapprove of the way the U.S. Supreme Court is handling its job? | ||
Political ideology also structures opinion of the Court. Table 3 shows approval by ideology in July and September.
Table 3: Approval of the Supreme Court’s job performance, by political ideology, July and September 2023
Among adults
| Ideology | Approval | |
| Approve | Disapprove | |
| Sept. 2023 | ||
| Total | 43 | 57 |
| Very conservative | 73 | 27 |
| Somewhat conservative | 69 | 31 |
| Moderate | 37 | 63 |
| Somewhat liberal | 22 | 78 |
| Very liberal | 6 | 94 |
| July 2023 | ||
| Total | 45 | 55 |
| Very conservative | 82 | 18 |
| Somewhat conservative | 69 | 31 |
| Moderate | 39 | 61 |
| Somewhat liberal | 17 | 83 |
| Very liberal | 9 | 91 |
| Marquette Law School Poll, national surveys, July 7-12, 2023 & Sept. 18-25, 2023 | ||
| Question: Overall, how much do you approve or disapprove of the way the U.S. Supreme Court is handling its job? | ||
| Question: Generally speaking, how would you describe your political views? | ||
Ideological views also structure reaction to individual decisions of the Court. Some decisions are more popular with all respondents, and some less popular, but reaction follows ideological lines for each of five major decisions of recent years.
Table 4 shows overall reaction to each decision. Four of the five decisions have a majority of the public in favor, while the decision overturning Roe v. Wade has a majority opposed.
Table 4: Favor or oppose recent major Court decisions
Among adults
| Decision | Favor or oppose | |
| Favor | Oppose | |
| Same-sex marriage | 69 | 31 |
| LGBT anti-discrimination protection | 85 | 15 |
| Overturn Roe v. Wade | 36 | 64 |
| Guns outside home | 64 | 36 |
| Ban use of race in admissions | 77 | 23 |
| Marquette Law School Poll, national survey, Sept. 18-25, 2023 | ||
| Question: In 2015, the Supreme Court ruled that the Constitution guarantees a right to same-sex marriage. How much do you favor or oppose this decision? | ||
| Question: In 2020, the Supreme Court ruled that a federal civil rights law protects gay and transgender workers from workplace discrimination. How much do you favor or oppose this decision? | ||
| Question: In 2022, the Supreme Court overturned Roe v. Wade, thus striking down the 1973 decision that made abortion legal in all 50 states. How much do you favor or oppose this decision? | ||
| Question: In 2022, the Supreme Court ruled that, subject to some restrictions, the Second Amendment protects an individual’s right to carry a handgun for self-defense outside the home. How much do you favor or oppose this decision? | ||
| Question: In 2023, the Supreme Court ruled that colleges cannot use race as a factor in deciding which applicants to admit. How much do you favor or oppose this decision? | ||
Table 5 shows the percentage favoring each of those decisions by respondent ideology. Liberals are more in favor of two decisions that are conventionally viewed as liberal—same-sex marriage and anti-discrimination protection for LGBT workers—and conservatives are less in favor. Conservatives are more in favor, and liberals less so, for decisions conventionally viewed as conservative—abortion, guns outside the home, and banning the use of race in college admissions.
Table 5: Favor recent Court decisions, by ideology
Adults
| Ideology | Percentage favoring decision | ||||
| Same-sex marriage | LGBT anti-discrimination protection | Overturn Roe v. Wade | Guns outside home | Ban use of race in admissions | |
| Very conservative | 34 | 72 | 75 | 84 | 93 |
| Somewhat conservative | 54 | 77 | 63 | 83 | 96 |
| Moderate | 76 | 88 | 26 | 71 | 76 |
| Somewhat liberal | 87 | 92 | 10 | 34 | 63 |
| Very liberal | 96 | 95 | 6 | 29 | 47 |
| Marquette Law School Poll, national survey, Sept. 18-25, 2023 | |||||
| Question: Generally speaking, how would you describe your political views?
Questions about cases: See under Table 4 for phrasings.
|
|||||
As with ideology, partisanship structures reaction to decisions, as shown in Table 6.
Table 6: Favor recent Court decisions, by party identification
Adults
| Party ID | Percentage favoring decision | ||||
| Same-sex marriage | LGBT anti-discrimination protection | Overturn Roe v. Wade | Guns outside home | Ban use of race in admissions | |
| Republican | 50 | 77 | 60 | 88 | 94 |
| Independent | 70 | 84 | 39 | 73 | 84 |
| Democrat | 87 | 92 | 13 | 40 | 60 |
| Marquette Law School Poll, national survey, Sept. 18-25, 2023 | |||||
| Question: Generally speaking, do you usually think of yourself as a Republican, a Democrat, or an Independent? | |||||
| Question for independents: Do you think of yourself as closer to the Republican Party or to the Democratic Party? (Only those answering that they are not closer to either party form “independent” group in table, as explained above.)
Questions about cases: See under Table 4 for phrasings.
|
|||||
Attention to news about the Court
In September, prior to the start of the Court’s October term, few people (17%) said they had heard or read “a lot” about the court in the previous month, while 61% said they had heard “a little” news and 22% had heard “nothing at all.”
Twenty-nine percent said they had heard a lot about news concerning Justice Clarence Thomas’s submission of revised financial disclosure reports on Aug. 31, though more (39%) said they had heard nothing at all about this and 32% had heard a little. After news stories about Thomas’s financial reports first surfaced, the May Marquette poll found that 33% had heard a lot, 32% had heard a little, and 35% had heard nothing at all.
Recent news concerning the justices’ financial disclosures and related matters have raised attention to the ethical standards of the Court. Table 7 shows the trend since May in perception of the justices’ ethical standards. Public estimation on the justices’ honesty and ethical standards has increased slightly in this time.
Table 7: Honesty and ethical standards of U.S. Supreme Court justices
Among adults
| Poll dates | Perceived honesty and ethical standards | ||
| Very high/high | Average | Low/Very low | |
| 9/18-25/23 | 30 | 41 | 29 |
| 7/7-12/23 | 32 | 33 | 35 |
| 5/8-18/23 | 26 | 39 | 35 |
| Marquette Law School Poll, national surveys | |||
| Question: U.S. Supreme Court justices: Please tell me how you would rate the honesty and ethical standards of people in these different fields? | |||
Attention to Supreme Court decisions naturally surges after decisions are handed down and then declines as the decisions themselves recede into the past. Table 8 shows how attention to news concerning the case (decided in June) to ban the use of race in college admissions was quite low in May prior to the decision, rose sharply in July, and declined in September.
Table 8: Attention to news about race in admissions decision
Among adults
| Poll dates | Attention to news about the case | ||
| A lot | A little | Nothing at all | |
| 9/18-25/23 | 31 | 45 | 23 |
| 7/7-12/23 | 51 | 31 | 18 |
| 5/8-18/23 | 16 | 44 | 40 |
| Marquette Law School Poll, national surveys | |||
| Question: Here are some recent topics in the news. How much have you heard or read about each of these? A Supreme Court case concerning the use of race in college admissions. | |||
Awareness of the makeup of the Court, in terms of which party’s presidents have appointed a majority of justices, declined slightly in September, with 32% saying Republican presidents had definitely appointed a majority of justices, 42% saying Republican presidents had probably done so, and 26% saying a majority had definitely or probably been appointed by Democrats. The percentage correctly saying Republicans appointed a majority increased after 2020 when the appointment of Justice Amy Coney Barrett created the sixth member of the Court appointed by Republican presidents. Since then, awareness of the majority has fluctuated modestly, as shown in Table 9.
Table 9: Belief that majority of Court appointed by which party’s presidents
Among adults
| Poll dates | Majority appointed by | ||
| Definitely/Probably Dem majority | Probably Rep majority | Definitely Rep majority | |
| 9/18-25/23 | 26 | 42 | 32 |
| 7/7-12/23 | 22 | 42 | 36 |
| 5/8-18/23 | 29 | 41 | 30 |
| 3/13-22/23 | 27 | 41 | 31 |
| 1/9-20/23 | 23 | 41 | 36 |
| 11/15-22/22 | 24 | 40 | 35 |
| 9/7-14/22 | 22 | 40 | 37 |
| 7/5-12/22 | 20 | 40 | 40 |
| 5/9-19/22 | 31 | 39 | 31 |
| 3/14-24/22 | 28 | 47 | 24 |
| 1/10-21/22 | 23 | 44 | 33 |
| 11/1-10/21 | 28 | 44 | 28 |
| 9/7-16/21 | 25 | 46 | 29 |
| 7/16-26/21 | 24 | 45 | 30 |
| 9/8-15/20 | 28 | 51 | 21 |
| 9/3-13/19 | 27 | 53 | 19 |
| Marquette Law School Poll, national surveys | |||
| Question: What is your guess as to whether a majority of the current U.S. Supreme Court justices were appointed by Democratic or Republican presidents? | |||
Confidence in institutions
Confidence in several institutions is summarized in Table 10. Juries in criminal cases have the highest confidence among the six institutions and the lowest percentage saying little or no confidence, followed by state supreme courts. The U.S. Justice Department has the same percentage with high confidence as the state supreme courts, but a higher percentage with little or no confidence. More respondents express little confidence than express high confidence in the U.S. Supreme Court, Congress, or the presidency, though by different margins in each instance.
Table 10: Confidence in institutions
Among adults
| Institution | Confidence | ||
| Great deal/a lot | Some | Little/None | |
| Juries that decide criminal cases | 40 | 41 | 19 |
| Your state supreme court | 30 | 45 | 25 |
| The U.S. Department of Justice | 30 | 35 | 35 |
| U.S. Supreme Court | 28 | 37 | 35 |
| The presidency | 24 | 33 | 43 |
| Congress | 12 | 38 | 49 |
| Marquette Law School Poll, national survey, Sept. 18-25, 2023 | |||
| Question: Here is a list of institutions in American society. How much confidence do you have in each one? | |||
Confidence in juries is less divided by partisanship than is confidence in other institutions, as shown in Table 11. With no partisan group holding strongly negative views of juries, the overall confidence is higher. A higher percentage of Democrats express high confidence in juries, but the percentages with low confidence are similar across the partisan groups. This question was first asked in the current survey, so no trend data are available.
Table 11: Confidence in juries in criminal cases, with party identification, September 2023
Among adults
| Party ID | Confidence | ||
| Great deal/a lot | Some | Little/None | |
| Total | 40 | 41 | 19 |
| Republican | 37 | 44 | 19 |
| Independent | 30 | 47 | 23 |
| Democrat | 46 | 36 | 18 |
| Marquette Law School Poll, national surveys, July 7-12, 2023 & Sept. 18-25, 2023 | |||
| Question: Here is a list of institutions in American society. How much confidence do you have in each one? Juries that decide guilt or innocence in criminal cases | |||
The Department of Justice has become the subject of partisan debate over its handling of a number of prosecutions and investigations in recent years. Overall, 30% of the public say they have a great deal or a lot of confidence in the DOJ, while 35% say they have some confidence. A substantial 35% say they have little or no confidence. Those with high confidence increased from 25% in July, while those with little or no confidence declined from 41%.
Partisans are substantially divided concerning the Department of Justice. These differences are shown in Table 12. High confidence increased, at least slightly, in each partisan group in September. The percentage with little or no confidence declined among Republicans and independents, but rose slightly among Democrats.
Table 12: Confidence in the Department of Justice, with party identification, July and September 2023
Among adults
| Party ID | Confidence | ||
| Great deal/a lot | Some | Little/None | |
| Sept. 2023 | |||
| Total | 30 | 35 | 35 |
| Republican | 17 | 33 | 51 |
| Independent | 19 | 52 | 29 |
| Democrat | 45 | 32 | 23 |
| July 2023 | |||
| Total | 25 | 34 | 41 |
| Republican | 13 | 28 | 58 |
| Independent | 18 | 33 | 49 |
| Democrat | 40 | 41 | 20 |
| Marquette Law School Poll, national surveys, July 7-12, 2023 & Sept. 18-25, 2023 | |||
| Question: The U.S. Department of Justice: Here is a list of institutions in American society. How much confidence do you have in each one? | |||
Confidence in the Court as an institution declined 3 percentage points in September, with 28% saying they have a great deal or a lot of confidence in the Court, down from 31% in July. However, there was an increase in those saying they had “some” confidence in the Court, from 32% in July to 37% in September, and a decrease in those with little or no confidence, from 37% in July to 35% in September.
The full trend is shown in Table 13.
Table 13: Confidence in the U.S. Supreme Court
Among adults
| Poll dates | Confidence | ||
| Great deal/a lot | Some | Little/None | |
| 9/18-25/23 | 28 | 37 | 35 |
| 7/7-12/23 | 31 | 32 | 37 |
| 5/8-18/23 | 25 | 36 | 39 |
| 3/13-22/23 | 28 | 40 | 32 |
| 1/9-20/23 | 31 | 38 | 31 |
| 11/15-22/22 | 30 | 36 | 34 |
| 9/7-14/22 | 30 | 34 | 36 |
| 7/5-12/22 | 28 | 28 | 44 |
| 9/8-15/20 | 39 | 45 | 16 |
| 9/3-13/19 | 37 | 42 | 20 |
| Marquette Law School Poll, national surveys | |||
| Question: The U.S. Supreme Court: Here is a list of institutions in American society. How much confidence do you have in each one? | |||
Confidence in the Supreme Court remains higher than confidence in Congress or the presidency. Confidence in Congress declined from July to September.
In September, 12% said they had a great deal or a lot of confidence in Congress, down from 14% in July, while those saying they had little or no confidence in Congress rose to 49% from 43%. The poll was completed before Congress took up, and eventually passed, a continuing resolution to fund the government through mid-November, thus avoiding a federal government shutdown.
There was also a decline in confidence in the presidency, with 24% having a great deal or a lot of confidence in September, compared to 28% in July. Those with little or no confidence increased to 43% from 40%.
These trends for Congress and the presidency are shown in Table 14 and Table 15.
Table 14: Confidence in the Congress
Among adults
| Poll dates | Confidence | ||
| Great deal/a lot | Some | Little/None | |
| 9/18-25/23 | 12 | 38 | 49 |
| 7/7-12/23 | 14 | 44 | 43 |
| 5/8-18/23 | 11 | 41 | 49 |
| 3/13-22/23 | 15 | 43 | 42 |
| 1/9-20/23 | 13 | 43 | 44 |
| 11/15-22/22 | 17 | 43 | 40 |
| 9/7-14/22 | 16 | 37 | 47 |
| 7/5-12/22 | 10 | 35 | 56 |
| 9/8-15/20 | 13 | 42 | 44 |
| 9/3-13/19 | 10 | 39 | 51 |
| Marquette Law School Poll, national surveys | |||
| Question: Congress: Here is a list of institutions in American society. How much confidence do you have in each one? | |||
Table 15: Confidence in the presidency
Among adults
| Poll dates | Confidence | ||
| Great deal/a lot | Some | Little/None | |
| 9/18-25/23 | 24 | 33 | 43 |
| 7/7-12/23 | 28 | 32 | 40 |
| 5/8-18/23 | 25 | 30 | 45 |
| 3/13-22/23 | 26 | 34 | 40 |
| 1/9-20/23 | 26 | 30 | 43 |
| 11/15-22/22 | 30 | 33 | 37 |
| 9/7-14/22 | 33 | 29 | 38 |
| 7/5-12/22 | 21 | 31 | 48 |
| 9/8-15/20 | 31 | 23 | 45 |
| 9/3-13/19 | 28 | 25 | 47 |
| Marquette Law School Poll, national surveys | |||
| Question: The presidency: Here is a list of institutions in American society. How much confidence do you have in each one? | |||
Perceived ideology of the Supreme Court
Public perception of the political ideology of the U.S. Supreme Court has shifted in a conservative direction since 2019, as shown in Table 16. In September 2019, 38% of the public saw the Court as very or somewhat conservative. In the current poll, 57% see the Court that way. Over this same period, the percentage saying the Court is moderate declined from 50% to 32%. Few people see the Court as liberal or very liberal: just 10% in both the July and September polls.
The September poll shows a decline in the percentage, 20%, saying the Court is “very conservative,” down from 27% in July. This is the lowest percentage with this view of the Court since March 2022.
Table 16: Perceived ideology of the U.S. Supreme Court
Among adults
| Poll dates | Perceived ideology | ||||
| Very conservative | Somewhat conservative | Moderate | Somewhat liberal | Very liberal | |
| 9/18-25/23 | 20 | 37 | 32 | 7 | 3 |
| 7/7-12/23 | 27 | 35 | 28 | 7 | 3 |
| 5/8-18/23 | 24 | 33 | 30 | 10 | 3 |
| 3/13-22/23 | 23 | 35 | 34 | 6 | 2 |
| 1/9-20/23 | 22 | 37 | 31 | 8 | 2 |
| 11/15-22/22 | 25 | 36 | 32 | 6 | 2 |
| 9/7-14/22 | 29 | 35 | 27 | 5 | 3 |
| 7/5-12/22 | 34 | 33 | 21 | 7 | 3 |
| 5/9-19/22 | 23 | 33 | 34 | 8 | 2 |
| 3/14-24/22 | 15 | 37 | 36 | 10 | 2 |
| 1/10-21/22 | 17 | 38 | 35 | 8 | 2 |
| 11/1-10/21 | 15 | 35 | 39 | 8 | 1 |
| 9/7-16/21 | 16 | 35 | 40 | 7 | 2 |
| 7/16-26/21 | 13 | 37 | 42 | 6 | 1 |
| 9/8-15/20 | 5 | 30 | 54 | 9 | 2 |
| 9/3-13/19 | 5 | 33 | 50 | 9 | 3 |
| Marquette Law School Poll, national surveys | |||||
| Question: The U.S. Supreme Court: In general, would you describe each of the following as…? | |||||
Since the Marquette Law Poll’s first national Supreme Court survey in 2019, there has been an increase in the percentage of the public who think the justices’ decisions are motivated by politics. It is 52% in the current poll, while it was 35% in the first survey in September 2019. Following the smallest percentage, 29% in July 2021, and a similarly low percentage (30%) in November 2021, there was a sharp increase beginning with the January 2022 poll, when 47% thought that justices’ decisions are motivated by politics. The full trend is shown in Table 17.
Table 17: Are justices’ decisions motivated mainly by the law or mainly by politics?
Among adults
| Poll dates | Perceived motivation | |
| Mainly politics | Mainly the law | |
| 9/18-25/23 | 52 | 48 |
| 7/7-12/23 | 58 | 42 |
| 1/9-20/23 | 49 | 51 |
| 7/5-12/22 | 52 | 48 |
| 1/10-21/22 | 47 | 53 |
| 11/1-10/21 | 30 | 70 |
| 9/7-16/21 | 39 | 61 |
| 7/16-26/21 | 29 | 71 |
| 9/8-15/20 | 37 | 62 |
| 9/3-13/19 | 35 | 64 |
| Marquette Law School Poll, national surveys | ||
| Question: In general, what most often motivates Supreme Court justices’ decisions? | ||
Support for increasing the size of the Supreme Court has increased gradually since 2019, with 54% favoring expanding the Court and 46% opposed in the current survey. The full trend is shown in Table 18.
Table 18: Favor or oppose expanding the U.S. Supreme Court
Among adults
| Poll dates | Increase number of justices | |
| Favor | Oppose | |
| 9/18-25/23 | 54 | 46 |
| 11/15-22/22 | 47 | 53 |
| 9/7-14/22 | 51 | 49 |
| 7/5-12/22 | 49 | 51 |
| 11/1-10/21 | 48 | 52 |
| 9/7-16/21 | 48 | 51 |
| 7/16-26/21 | 48 | 51 |
| 9/8-15/20 | 46 | 53 |
| 9/3-13/19 | 42 | 56 |
| Marquette Law School Poll, national surveys | ||
| Question: How much do you favor or oppose a proposal to increase the number of justices on the U.S. Supreme Court? | ||
About the Marquette Law School Poll
The survey was conducted Sept. 18-25, 2023, interviewing 1,007 adults nationwide, with a margin of error of +/-4.1 percentage points. Interviews were conducted using the SSRS Opinion Panel, a national probability sample with interviews conducted online. The detailed methodology statement, survey instrument, topline results, and crosstabs for this release are available on the Marquette Law Poll website. Some items from this survey are held for later release.
Wording of questions about future and past Supreme Court decisions: These items do not attempt to exactly frame the particular issues in specific cases but rather address the topic in more general terms.
The wording of questions about previous decisions includes:
Opinion of same-sex marriage decision:
- In 2015, the Supreme Court ruled that the Constitution guarantees a right to same-sex marriage. How much do you favor or oppose this decision?
Opinion on anti-discrimination law protecting gay and transgender employees
- In 2020, the Supreme Court ruled that a federal civil rights law protects gay and transgender workers from workplace discrimination. How much do you favor or oppose this decision?
Opinion of Dobbs decision, striking down Roe v. Wade
- In 2022 the Supreme Court overturned Roe v. Wade, thus striking down the 1973 decision that made abortion legal in all 50 states. How much do you favor or oppose this decision?
Opinion of decision concerning possession of guns outside the home
- In 2022, the Supreme Court ruled that, subject to some restrictions, the Second Amendment protects an individual’s right to carry a handgun for self-defense outside the home. How much do you favor or oppose this decision?
Opinion of decision banning use of race in college admissions
In 2023, the Supreme Court ruled that colleges cannot use race as a factor in deciding which applicants to admit. How much do you favor or oppose this decision?
Related Content


Polls
Legal News
- State lawsuit seeks electronic ballots for disabled voters
- Attorney disbarred after sexual assault conviction
- Wisconsin mom freed from ICE custody, speaks out
- Wisconsin Supreme Court weighs judicial recusal changes
- Toney eyes rematch with Kaul in AG race
- State Supreme Court to hear gerrymander case
- Former prison lieutenant fined $500 in inmate death case
- Officials worry about USPS speed with ballot delivery
- Judge: Ex-Milwaukee teacher’s aide can return to U.S.
- Ex-bank manager sentenced for $350K embezzlement
- Dugan sentencing delayed for oral arguments
- Wisconsin women’s prisons 78% over capacity, nearing record
Case Digests
- Involuntary Medication-Competency to Stand Trial
- Domestic Abuse Injunction-Personal Jurisdiction
- Informer Privilege Statute-Clear Error
- Sixth Amendment-Third-Party Perpetrator Evidence
- Plea Withdrawal-Manifest Injustice
- Ineffective Assistance of Counsel-Procedural Bar
- CHIPS Confidentiality-Remedial Versus Punitive Sanctions
- Insurance Law
- Breach of Contract-Rule 12(b)(6) Dismissal
- Constitutional Law-Qualified Immunity-First Amendment Retaliation
- Qualified Immunity-Excessive Force-Civil Rights
- Hostile Work Environment-Sexual Harassment