

 Free Newsletter

Marquette Law School Poll survey of Wisconsin finds Biden and Trump tied
By: Bridgetower Media Newswires//June 27, 2024//
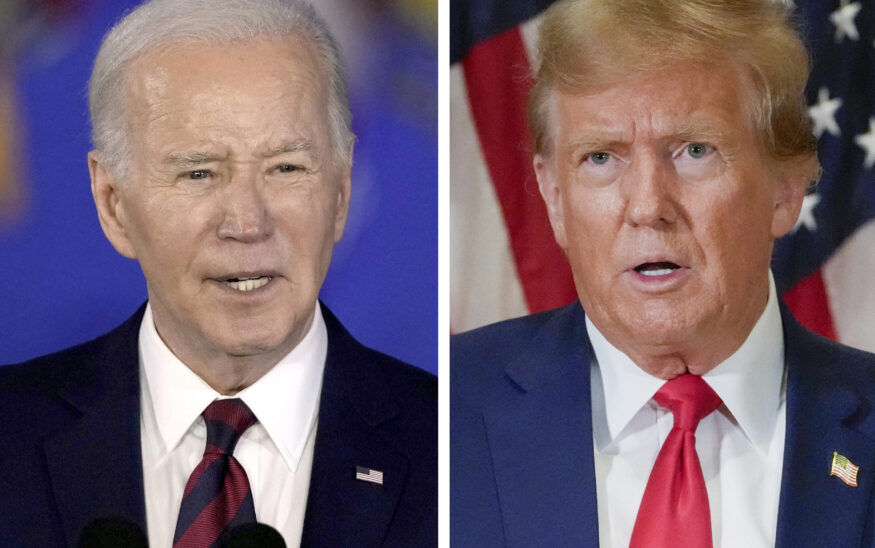
In this combination photo, President Joe Biden speaks in Milwaukee, March 13, 2024, left, and former President Donald Trump speaks in New York, Jan. 11, 2024. Voters in Wisconsin, New York, Connecticut and Rhode Island will weigh in Tuesday, April 2, on their parties' presidential nominees, a largely symbolic vote now that both Biden and Trump have locked up the Democratic and Republican nominations. (AP Photo)
Marquette Law School Poll survey of Wisconsin finds Biden and Trump tied
By: Bridgetower Media Newswires//June 27, 2024//


By Marquette University
MILWAUKEE – A new Marquette Law School Poll survey of Wisconsin finds President Joe Biden and former President Donald Trump tied at 50% in a head-to-head matchup among registered voters. Among likely voters, Biden is the choice of 51% and Trump the choice of 49%. These results include initially undecided voters who were then asked whom they would vote for if they had to choose between Biden and Trump.
Also notable:
- Trump led by two points with both registered and likely voters in April
- 55% say Trump was guilty in the New York hush money trial, as the jury ruled; 36% say he was not guilty and the jury made the wrong ruling; 9% don’t know
- Views of public schools are less positive in this survey than they were last fall
In a six-candidate race, Trump is favored by 43% and Biden by 40%, while Robert F. Kennedy Jr. receives 8%, Libertarian Chase Oliver 2%, Green Party candidate Jill Stein 2%, and independent Cornel West 4% among registered voters. Among likely voters, it is Trump 44%, Biden 42%, Kennedy 7%, Oliver 1%, Stein 2%, and West 3%.
In the U.S. Senate race, Democratic Sen. Tammy Baldwin is supported by 52% to Republican Eric Hovde’s 47% among registered voters. The results are the same with likely voters. These results include initially undecided voters who were then asked whom they would vote for if they had to choose. When initially asked, Baldwin receives 45%, Hovde 38%, and 17% say they are undecided among registered voters, and among likely voters Baldwin receives 49%, Hovde 40%, and 11% are undecided.
The recent trend in presidential vote choice is shown in Table 1.
Table 1: Vote for Biden or Trump
| Poll dates | Vote choice | ||
| Joe Biden | Donald Trump | Haven’t decided/Neither | |
| Registered voters | |||
| 6/12-20/24 | 50 | 50 | 0 |
| 4/3-10/24 | 49 | 51 | 0 |
| 1/24-31/24 | 49 | 49 | 2 |
| 10/26-11/2/23 | 50 | 48 | 1 |
| Likely voters | |||
| 6/12-20/24 | 51 | 49 | 0 |
| 4/3-10/24 | 49 | 51 | 0 |
| 1/24-31/24 | 49 | 50 | 1 |
| 10/26-11/2/23 | 50 | 48 | 1 |
| Marquette Law School Poll, Wisconsin survey, latest: June 12-20, 2024 | |||
| Question: If the 2024 election for president were held today between former President Donald Trump, the Republican, and President Joe Biden, the Democrat, would you vote for Donald Trump or for Joe Biden or haven’t you decided? | |||
| Question: If you had to choose, would you vote for Biden or for Trump? | |||
The survey was conducted June 12-20, 2024, interviewing 871 Wisconsin registered voters, with a margin of error of +/-4.6 percentage points and 784 likely voters, with a margin of error of +/-4.9 percentage points. (All results are stated as percentages.)
The initial vote question includes the option of “haven’t decided.” There are 12% who say they are undecided in the June poll of presidential preference. The trend in vote choice, including undecided, is shown in Table 2. Fewer likely voters remain undecided than among registered voters. In either case, the undecided group remains larger than the margin between the candidates.
Table 2: Vote for Biden or Trump, including option of undecided
| Poll dates | Vote choice | ||
| Joe Biden | Donald Trump | Haven’t decided | |
| Registered voters | |||
| 6/12-20/24 | 44 | 44 | 12 |
| 4/3-10/24 | 44 | 47 | 8 |
| 1/24-31/24 | 44 | 44 | 12 |
| 10/26-11/2/23 | 45 | 42 | 12 |
| Likely voters | |||
| 6/12-20/24 | 47 | 44 | 9 |
| 4/3-10/24 | 45 | 48 | 6 |
| 1/24-31/24 | 44 | 46 | 10 |
| 10/26-11/2/23 | 47 | 45 | 8 |
| Marquette Law School Poll, Wisconsin survey, latest: June 12-20, 2024 | |||
| Question: If the 2024 election for president were held today between former President Donald Trump, the Republican, and President Joe Biden, the Democrat, would you vote for Donald Trump or for Joe Biden or haven’t you decided? | |||
The trend including independent and third-party candidates is shown in Table 3. Oliver was not included prior to the June poll.
Table 3: Vote including third-party candidates
| Poll dates | Vote choice | ||||||
| Biden | Trump | Kennedy, Jr. | Oliver | Stein | West | Don’t know | |
| Registered voters | |||||||
| 6/12-20/24 | 40 | 43 | 8 | 2 | 2 | 4 | 1 |
| 4/3-10/24 | 40 | 41 | 13 | N/A | 3 | 2 | 1 |
| 1/24-31/24 | 37 | 40 | 16 | N/A | 4 | 2 | 1 |
| Likely voters | |||||||
| 6/12-20/24 | 42 | 44 | 7 | 1 | 2 | 3 | 1 |
| 4/3-10/24 | 41 | 42 | 12 | N/A | 3 | 1 | 1 |
| 1/24-31/24 | 39 | 41 | 13 | N/A | 4 | 2 | 1 |
| Marquette Law School Poll, Wisconsin survey, latest: June 12-20, 2024 | |||||||
| Question: If the presidential ballot included additional candidates, would you vote for (Democrat Joe Biden), (Republican Donald Trump), (independent Robert F. Kennedy Jr), (Libertarian Chase Oliver), (the Green Party’s Jill Stein), or (independent Cornel West)? | |||||||
Reactions to the NY Trump trial verdict
The New York trial of Trump attracted considerable public attention, with 76% saying they had read or heard a lot about the trial, while 21% heard a little and 3% heard nothing at all. By comparison, 57% said they had heard a lot about Hunter Biden’s trial in Delaware for purchasing a gun while addicted to cocaine, 36% heard a little, and 8% heard or read nothing at all.
Trump’s favorability rating dipped slightly in June, to 41% favorable from 43% favorable in April. His unfavorable rating ticked up one point, to 57% from 56% in April.
A majority of registered voters, 55%, say they think Trump is guilty of the charges in his New York trial, while 36% say he is not guilty and 9% say they don’t know. Almost three-quarters of Republicans say Trump is not guilty, while a majority of independents and almost all Democrats believe he is guilty, as shown in Table 4.
Table 4: Trump guilt, by party identification Among registered voters
| Party ID | Guilty or not guilty | ||
| Guilty | Not guilty | Don’t know | |
| Republican | 13 | 72 | 15 |
| Independent | 54 | 28 | 18 |
| Democrat | 98 | 0 | 1 |
| Marquette Law School Poll, Wisconsin survey, June 12-20, 2024 | |||
| Question: As you may know, Donald Trump was found guilty on 34 felony charges by a jury in New York on May 30. Do you think Trump is guilty of the charges as the jury ruled, or do you think he is not guilty and the jury made the wrong ruling? | |||
Sentencing for Trump is set for July 11. Among registered voters, 27% say Trump should receive no penalty at all, 12% say he should be fined, 14% say he should receive probation without jail, and 36% say he should be sentenced to some time in jail. Ten percent say they don’t know.
Almost half believe the conviction will definitely (20%) or probably (29%) be overturned on appeal, while 28% believe it probably will not be overturned, 7% say it definitely won’t be overturned, and 16% say they don’t know.
A substantial share of voters think the Trump prosecution will lead to Republican prosecutors charging Democratic politicians with crimes. Twenty-seven percent say the Trump case will definitely result in Republicans prosecuting Democrats, 43% say it will probably do so, 15% say it probably won’t, 2% say it definitely won’t lead to such prosecutions, and 12% who say they don’t know. Majorities of each partisan group think the Trump case will definitely or probably result in Republican prosecutors charging Democratic politicians. That includes 65% of Republicans, 63% of independents, and 77% of Democrats.
Following the trial, 42% say Trump should not have been prosecuted at all, while 50% say the prosecution was the right judgment call and 8% say they don’t know.
As for the prosecution of Hunter Biden, 11% say he should not have been prosecuted, while 76% say prosecution was the right judgment call and 13% don’t know.
Presidential vote by party identification
Table 5 shows the Biden vs. Trump results by party identification. Among Democrats, 98% support Biden with 2% crossing over to Trump. Among Republicans, 93% say they will vote for Trump with 7% crossing over to Biden. Independents lean substantially to Trump in this month’s survey, with 57% voting for Trump and 41% for Biden. Partisan loyalty is at its highest level since November for both parties in the June poll.
Table 5: Vote for Biden or Trump, by party identification Among registered voters
| Party ID | Vote choice | ||
| Joe Biden | Donald Trump | Haven’t decided/Neither | |
| 6/12-20/24 | |||
| Republican | 7 | 93 | 0 |
| Independent | 41 | 57 | 2 |
| Democrat | 98 | 2 | 0 |
| 4/3-10/24 | |||
| Republican | 9 | 91 | 0 |
| Independent | 41 | 59 | 0 |
| Democrat | 97 | 3 | 0 |
| 1/24-31/24 | |||
| Republican | 10 | 90 | 0 |
| Independent | 49 | 42 | 8 |
| Democrat | 91 | 9 | 0 |
| 10/26-11/2/23 | |||
| Republican | 10 | 88 | 1 |
| Independent | 47 | 47 | 4 |
| Democrat | 94 | 6 | 0 |
| Marquette Law School Poll, Wisconsin survey, June 12-20, 2024 | |||
| Question: If the 2024 election for president were held today between former President Donald Trump, the Republican, and President Joe Biden, the Democrat, would you vote for Donald Trump or for Joe Biden or haven’t you decided? | |||
| Question: If you had to choose, would you vote for Biden or for Trump? | |||
In the six-way ballot test, Kennedy takes an equal share of votes from Republicans and from Democrats, at 6%. That is a reduction of the share Kennedy took from each party in April or in January. Partisans remain about equally loyal to their nominee. The other three candidates—Oliver, Stein and West—take a total of 5% from Republicans and 7% from Democrats.
Independent voters are more drawn to the third-party candidates than are partisans. Kennedy receives support from 26% of independents, Oliver 4%, Stein 9%, and West 8%. Among independents in the six-way race, Trump receives 32% and Biden 21%.
These results are shown in Table 6.
Table 6: Six-way ballot, by party identification Among registered voters
| Party ID | Vote choice | ||||||
| Biden | Trump | Kennedy, Jr. | Oliver | Stein | West | Don’t know | |
| 6/12-20/24 | |||||||
| Republican | 2 | 86 | 6 | 2 | 1 | 2 | 1 |
| Independent | 21 | 32 | 26 | 4 | 9 | 8 | 1 |
| Democrat | 85 | 2 | 6 | 1 | 2 | 4 | 0 |
| 4/3-10/24 | |||||||
| Republican | 4 | 79 | 13 | N/A | 3 | 0 | 1 |
| Independent | 23 | 32 | 32 | N/A | 5 | 4 | 5 |
| Democrat | 85 | 1 | 8 | N/A | 4 | 2 | 0 |
| 1/24-31/24 | |||||||
| Republican | 5 | 76 | 16 | N/A | 1 | 1 | 0 |
| Independent | 33 | 27 | 28 | N/A | 3 | 4 | 2 |
| Democrat | 73 | 5 | 12 | N/A | 8 | 2 | 1 |
| Marquette Law School Poll, Wisconsin survey, June 12-20, 2024 | |||||||
| Question: If the presidential ballot included additional candidates, would you vote for Democrat Joe Biden, Republican Donald Trump, independent Robert F. Kennedy Jr, independent Cornel West, Libertarian Chase Oliver, or the Green Party’s Jill Stein? | |||||||
Senate vote, by party identification
In the U.S. Senate race in Wisconsin, as shown in Table 7, among registered voters, Baldwin receives 95% of Democrats and Hovde wins 5%. Among registered voters, Hovde holds 88% of Republicans, while Baldwin takes 12%. Independents among registered voters favor Baldwin by 52% to Hovde’s 48%.
With likely voters, partisan loyalty is slightly higher for both parties, but independents favor Hovde by 54% to 46% for Baldwin.
Table 7: Vote for Baldwin or Hovde
| Party ID | Vote choice | |||
| Poll Dates | Tammy Baldwin | Eric Hovde | Haven’t decided | |
| Registered voters | ||||
| Republican | 6/12-20/24 | 12 | 88 | 1 |
| Independent | 6/12-20/24 | 52 | 48 | 0 |
| Democrat | 6/12-20/24 | 95 | 5 | 0 |
| Likely voters | ||||
| Republican | 6/12-20/24 | 10 | 90 | 1 |
| Independent | 6/12-20/24 | 46 | 54 | 0 |
| Democrat | 6/12-20/24 | 97 | 3 | 0 |
| Marquette Law School Poll, Wisconsin survey, June 12-20, 2024 | ||||
| Question: If the 2024 election for U.S. Senate were held today between (Eric Hovde, the Republican), and (Tammy Baldwin, the Democrat), would you vote for (Eric Hovde) or for (Tammy Baldwin) or haven’t you decided? | ||||
| Question: If you had to choose, would you vote for (Hovde) or for (Baldwin?) | ||||
Enthusiasm and likelihood of voting
Registered voters are less enthusiastic about voting than they were in 2020, as shown in Table 8. In the current survey, 46% say they are very enthusiastic about voting in November, compared to 59% in June 2020.
Rather than increase as the election approaches, enthusiasm has declined from January to June, with a slight decline in the percent very enthusiastic, from 49% to 46% and a more substantial increase in those not at all enthusiastic, from 9% to 14%.
Table 8: Enthusiasm to vote in November election Among registered voters
| Poll dates | Enthusiastic | |||
| Very | Somewhat | Not too | Not at all | |
| 6/12-20/24 | 46 | 21 | 19 | 14 |
| 4/3-10/24 | 47 | 22 | 18 | 12 |
| 1/24-31/24 | 49 | 25 | 17 | 9 |
| 10/26-11/2/23 | 46 | 28 | 19 | 6 |
| 6/14-18/20 | 59 | 26 | 6 | 7 |
| Marquette Law School Poll, Wisconsin survey, June 12-20, 2024 | ||||
| Question: (2024) How enthusiastic are you about voting in the elections in November 2024 for president and other offices? Would you say you are very, somewhat, not too, or not at all enthusiastic? | ||||
| Question: (2020) How enthusiastic are you about voting in this November’s elections? Would you say you are very, somewhat, not too, or not at all enthusiastic? | ||||
Those who are very enthusiastic substantially prefer Trump to Biden, 61% to 39%, while those less enthusiastic (somewhat, not too, or not at all enthusiastic) prefer Biden to Trump by large margins, as shown in Table 9.
Table 9: Vote for Biden or Trump, by enthusiasm Among registered voters
| Enthusiasm | Vote choice 2024 | ||
| Joe Biden | Donald Trump | Haven’t decided/Neither | |
| Very enthusiastic | 39 | 61 | 0 |
| Somewhat enthusiastic | 57 | 43 | 0 |
| Not too enthusiastic | 58 | 41 | 1 |
| Not at all enthusiastic | 65 | 33 | 1 |
| Marquette Law School Poll, Wisconsin survey, June 12-20, 2024 | |||
| Question: If the 2024 election for president were held today between former President Donald Trump, the Republican, and President Joe Biden, the Democrat, would you vote for Donald Trump or for Joe Biden or haven’t you decided? | |||
| Question: If you had to choose, would you vote for Biden or for Trump? | |||
| Question: How enthusiastic are you about voting in the elections in November 2024 for president and other offices? Would you say you are very, somewhat, not too, or not at all enthusiastic? | |||
Those who are very enthusiastic are also most likely to say they are certain to vote in November (98% of those who are “very enthusiastic”), while among those somewhat enthusiastic, 87% say they are certain to vote. The number terming themselves certain to vote declines further, to 73%, among the “not too enthusiastic” respondents and to 67% among the “not at all enthusiastic.” The full results are shown in Table 10.
Table 10: Likelihood of voting, by enthusiasm Among registered voters
| Enthusiasm | Likelihood of voting | |||
| Absolutely certain | Very likely | 50-50 | Will not vote | |
| Very enthusiastic | 98 | 2 | 0 | 0 |
| Somewhat enthusiastic | 87 | 10 | 2 | 0 |
| Not too enthusiastic | 73 | 13 | 13 | 0 |
| Not at all enthusiastic | 67 | 15 | 17 | 1 |
| Marquette Law School Poll, Wisconsin survey, June 12-20, 2024 | ||||
| Question: What are the chances that you will vote in the November 2024 general election for president, Congress, and other offices—are you absolutely certain to vote, very likely to vote, are the chances 50-50, or don’t you think you will vote? | ||||
| Question: How enthusiastic are you about voting in the elections in November 2024 for president and other offices? Would you say you are very, somewhat, not too, or not at all enthusiastic? | ||||
Favorability of presidential candidates
Table 11 shows the trend in favorability to presidential candidates among all registered voters. All the candidates are viewed more unfavorably than favorably, and the independent or third-party candidates are much less well known than Biden or Trump.
Biden and Trump are viewed similarly, with 40% seeing Biden favorably and 41% with a favorable view of Trump. Likewise, 58% have an unfavorable view of Biden and 57% have an unfavorable view of Trump. Views of Kennedy have grown more negative overall during a period when somewhat more people express an opinion about him (that is, as somewhat fewer people say they haven’t heard enough). Large percentages lack an opinion of Stein and West, while 90% say they haven’t heard enough about Oliver to have an opinion.
Table 11: Favorability to presidential candidates Among registered voters
| Poll dates | Favorability | |||
| Net favorable | Favorable | Unfavorable | Haven’t heard enough | |
| Joe Biden | ||||
| 6/12-20/24 | -18 | 40 | 58 | 1 |
| 4/3-10/24 | -19 | 40 | 59 | 1 |
| 1/24-31/24 | -17 | 41 | 58 | 1 |
| 10/26-11/2/23 | -14 | 42 | 56 | 2 |
| Donald Trump | ||||
| 6/12-20/24 | -16 | 41 | 57 | 2 |
| 4/3-10/24 | -13 | 43 | 56 | 1 |
| 1/24-31/24 | -18 | 40 | 58 | 1 |
| 10/26-11/2/23 | -24 | 37 | 61 | 2 |
| Robert F. Kennedy Jr. | ||||
| 6/12-20/24 | -24 | 25 | 49 | 26 |
| 4/3-10/24 | -15 | 30 | 45 | 25 |
| 1/24-31/24 | 2 | 35 | 33 | 32 |
| 10/26-11/2/23 | -8 | 31 | 39 | 30 |
| Chase Oliver | ||||
| 6/12-20/24 | -6 | 1 | 7 | 90 |
| Jill Stein | ||||
| 6/12-20/24 | -18 | 8 | 26 | 64 |
| 4/3-10/24 | -13 | 8 | 21 | 69 |
| 1/24-31/24 | -14 | 10 | 24 | 66 |
| Cornel West | ||||
| 6/12-20/24 | -7 | 9 | 16 | 73 |
| 4/3-10/24 | -8 | 7 | 15 | 75 |
| 1/24-31/24 | -12 | 7 | 19 | 73 |
| 10/26-11/2/23 | -14 | 6 | 20 | 69 |
| Marquette Law School Poll, Wisconsin surveys, latest: June 12-20, 2024 | ||||
| Question: Do you have a favorable or unfavorable opinion of (INSERT NAME) or haven’t you heard enough about them yet? | ||||
Both Biden and Trump are seen more unfavorably than favorably. A significant share of voters, 17%, see both of them unfavorably. For comparison, in June 2020, 8% had an unfavorable view of both Biden and Trump. Their combined favorability trend in this cycle is shown in Table 12.
Table 12: Combined favorability to Biden and Trump Among registered voters
| Poll dates | Combined Favorability | ||||
| Biden fav, Trump fav | Biden fav, Trump unfav | Biden unfav, Trump fav | Biden unfav, Trump unfav | Don’t know | |
| 6/12-20/24 | 0 | 39 | 41 | 17 | 3 |
| 4/3-10/24 | 2 | 38 | 41 | 17 | 2 |
| 1/24-31/24 | 2 | 40 | 38 | 18 | 2 |
| 10/26-11/2/23 | 1 | 41 | 36 | 18 | 4 |
| Marquette Law School Poll, Wisconsin survey, June 12-20, 2024 | |||||
| Question: Do you have a favorable or unfavorable opinion of (INSERT NAME) or haven’t you heard enough about them yet? | |||||
Those with favorable views of one candidate and unfavorable to the other are virtually certain to support the favored candidate. Among those unfavorable to both, Biden receives 54% and Trump 45%, as shown in Table 13.
Table 13: Vote by combined favorability Among registered voters
| Combined favorability | Vote choice | ||
| Joe Biden | Donald Trump | Haven’t decided/Neither | |
| Biden fav, Trump unfav | 100 | 0 | 0 |
| Biden unfav, Trump fav | 0 | 100 | 0 |
| Biden unfav, Trump unfav | 54 | 45 | 1 |
| Marquette Law School Poll, Wisconsin survey, June 12-20, 2024 | |||
| Question: If the 2024 election for president were held today between [President Joe Biden, the Democrat,] and [former President Donald Trump, the Republican,] would you vote for [Joe Biden] or for [Donald Trump] or haven’t you decided? | |||
| Question: If you had to choose, would you vote for [Biden] or for [Trump]? | |||
| Question: Do you have a favorable or unfavorable opinion of [NAME] or haven’t you heard enough about them yet? (Joe Biden) (Donald Trump) | |||
| Note: Too few cases favorable to both for meaningful analysis. | |||
Senate candidate favorability
Baldwin’s net favorability has fluctuated from slightly negative to slightly positive since June 2023, declining, for example, from +5 in April 2024 to +1 in this new survey. Hovde’s net favorable rating has declined since June 2023, when it was -4, to -9 in this June 2024 survey.
Eleven percent say they haven’t heard enough about Baldwin to have an opinion, which is unchanged since April. Hovde has become better known than previously, with 44% saying they haven’t heard enough, down from 56% in April.
These favorability trends are shown in Table 14.
Table 14: Favorability to Senate candidates Among registered voters
| Poll dates | Favorability | |||
| Net favorable | Favorable | Unfavorable | Haven’t heard enough | |
| Tammy Baldwin | ||||
| 6/12-20/24 | 1 | 45 | 44 | 11 |
| 4/3-10/24 | 5 | 47 | 42 | 11 |
| 1/24-31/24 | -3 | 42 | 45 | 13 |
| 10/26-11/2/23 | -2 | 41 | 43 | 15 |
| 6/8-13/23 | 3 | 40 | 37 | 22 |
| Eric Hovde | ||||
| 6/12-20/24 | -9 | 23 | 32 | 44 |
| 4/3-10/24 | -5 | 19 | 24 | 56 |
| 1/24-31/24 | -2 | 7 | 9 | 82 |
| 6/8-13/23 | -4 | 4 | 8 | 85 |
| Marquette Law School Poll, Wisconsin surveys, latest: June 12-20, 2024 | ||||
| Question: Do you have a favorable or unfavorable opinion of (INSERT NAME) or haven’t you heard enough about them yet? | ||||
Issues in the presidential campaign
Table 15 shows which presidential candidate is thought to do a better job on seven issues. Trump is seen as better on immigration and border security, the economy, and the Israel-Hamas war. He also holds a smaller edge on handling foreign relations. Biden has an advantage on Medicare & Social Security, health care, and abortion policy.
A substantial percentage, 13%-25%, say both candidates would be about the same or that neither would be good on an issue.
Table 15: Which candidate would do a better job on issues Among registered voters
| Issue | Who better | |||
| Biden | Trump | Both about the same | Neither good | |
| Immigration and border security | 28 | 52 | 8 | 13 |
| The Economy | 34 | 52 | 6 | 7 |
| Israel-Hamas war | 30 | 44 | 6 | 19 |
| Foreign relations | 39 | 45 | 5 | 11 |
| Medicare & Social Security | 43 | 36 | 11 | 10 |
| Healthcare | 43 | 34 | 11 | 11 |
| Abortion policy | 47 | 33 | 9 | 11 |
| Marquette Law School Poll, Wisconsin survey, June 12-20, 2024 | ||||
| Question: Do you think Joe Biden or Donald Trump would do a better job handling each of the following issues, they are both about the same or would neither be good on the issue? | ||||
Most important issues
Respondents were asked which one of seven issues would be the most important for deciding their vote. The economy is the top-rated issue, followed by immigration, abortion policy, and Medicare & Social Security. The other issues remain in single-digit percentages, as shown in Table 16.
Table 16: Most important issue Among registered voters
| Response | Percent |
| The economy | 31 |
| Immigration and border security | 19 |
| Abortion policy | 15 |
| Medicare & Social Security | 12 |
| Healthcare | 6 |
| Foreign relations | 5 |
| The war between Israel and Hamas in Gaza | 4 |
| Don’t know | 8 |
| Marquette Law School Poll, Wisconsin survey, June 12-20, 2024 | |
| Question: Which one of the following issues will be MOST important in deciding your vote for president? | |
Partisans differ on the most important issue, as shown in Table 17. Republicans are much more likely to rank the economy or immigration as most important, while placing little weight on any of the other issues. Independents most frequently rank the economy or immigration as their top issue, with Medicare & Social Security tied with abortion policy as the third most likely to be cited as the top issue. A plurality of Democrats put abortion policy as their top concern, followed by Medicare & Social Security, with the economy a more distant third most likely to be cited as the top issue. Only 3% of Democrats rank immigration as their top issue concern.
Table 17: Most important issue, by party identification Among registered voters
| Party ID | Issue | |||||||
| The economy | Immigration and border security | Healthcare | Foreign relations | Abortion policy | Medicare & Social Security | The war between Israel and Hamas in Gaza | Don’t know | |
| Republican | 48 | 35 | 1 | 2 | 5 | 4 | 2 | 4 |
| Independent | 36 | 19 | 4 | 4 | 9 | 9 | 6 | 12 |
| Democrat | 13 | 3 | 11 | 8 | 27 | 21 | 6 | 10 |
| Marquette Law School Poll, Wisconsin survey, latest: June 12-20, 2024 | ||||||||
| Question: Which one of the following issues will be MOST important in deciding your vote for president? | ||||||||
A majority continue to favor legal abortions in all (34%) or most (32%) circumstances, while 26% say abortion should be illegal in most circumstances and 8% say it should be illegal in all circumstances. The long-term trend of opinion about abortion is shown in Table 18.
Table 18: Abortion opinion trend Among registered voters
| Poll dates | Opinion | ||||
| Legal in all cases | Legal in most cases | Illegal in most cases | Illegal in all cases | Don’t know | |
| 6/12-20/24 | 34 | 32 | 26 | 8 | 0 |
| 4/3-10/24 | 28 | 36 | 26 | 9 | 1 |
| 6/8-13/23 | 32 | 34 | 25 | 6 | 1 |
| 8/10-15/22 | 30 | 35 | 25 | 5 | 3 |
| 6/14-20/22 | 27 | 31 | 24 | 11 | 5 |
| 10/26-31/21 | 23 | 38 | 23 | 11 | 4 |
| 2/19-23/20 | 18 | 37 | 22 | 15 | 6 |
| 10/24-28/18 | 26 | 29 | 24 | 14 | 4 |
| 9/12-16/18 | 26 | 36 | 21 | 9 | 6 |
| 7/11-15/18 | 27 | 36 | 18 | 11 | 6 |
| 10/23-26/14 | 24 | 34 | 24 | 15 | 3 |
| 10/21-24/13 | 26 | 36 | 25 | 10 | 2 |
| 10/25-28/12 | 28 | 32 | 23 | 12 | 4 |
| 10/11-14/12 | 25 | 34 | 25 | 12 | 3 |
| 9/27-30/12 | 25 | 35 | 23 | 12 | 3 |
| 9/13-16/12 | 26 | 34 | 23 | 13 | 3 |
| Marquette Law School Poll, Wisconsin survey, latest: June 12-20, 2024 | |||||
| Question: Do you think abortion should be legal in all cases, legal in most cases, illegal in most cases, or illegal in all cases? | |||||
Biden and Trump presidential job approval
Biden’s job approval in June stands at 40% with disapproval at 57%, unchanged since April. Table 19 shows the recent trend in job approval.
Table 19: Biden job approval Among registered voters
| Poll dates | Job approval | |||||
| Total approve | Total disapprove | Strongly approve | Somewhat approve | Somewhat disapprove | Strongly disapprove | |
| 6/12-20/24 | 40 | 57 | 16 | 24 | 10 | 47 |
| 4/3-10/24 | 40 | 57 | 16 | 24 | 8 | 49 |
| 1/24-31/24 | 41 | 58 | 18 | 23 | 10 | 48 |
| 10/26-11/2/23 | 42 | 57 | 17 | 25 | 12 | 44 |
| Marquette Law School Poll, Wisconsin survey, latest: June 12-20, 2024 | ||||||
| Question: Overall, do you approve or disapprove of the way Joe Biden is handling his job as president? | ||||||
Biden job approval by party identification is shown in Table 20. Republicans are nearly unanimous in their disapproval of Biden at 96%, with disapproval among independents at 68% and approval at 21%. Democrats are quite approving of Biden, with 83% approving and 14% disapproving.
Table 20: Biden job approval, by party identification Among registered voters
| Party ID | Job approval | ||
| Approve | Disapprove | Don’t know | |
| Republican | 4 | 96 | 0 |
| Independent | 21 | 68 | 11 |
| Democrat | 83 | 14 | 3 |
| Marquette Law School Poll, Wisconsin survey, June 12-20, 2024 | |||
| Question: Overall, do you approve or disapprove of the way Joe Biden is handling his job as president? | |||
Respondents were also asked whether they approved of the job Trump did when he was president. In June, 47% approved and 52% disapproved, the same as in the April poll. For comparison, Trump’s approval in the last Marquette Law School Poll survey before the 2020 election was the same: 47% approve and 52% disapprove.
Table 21 shows Trump approval by party identification. Virtually all Democrats, 96%, disapprove of how Trump handled his job as president, while a large majority of Republicans, 89%, approve. Independents are evenly balanced, with 48% approving and 48% disapproving.
Table 21: Trump job approval, by party identification Among registered voters
| Party ID | Job approval | ||
| Approve | Disapprove | Don’t know | |
| Republican | 89 | 11 | 0 |
| Independent | 48 | 48 | 4 |
| Democrat | 1 | 96 | 3 |
| Marquette Law School Poll, Wisconsin survey, June 12-20, 2024 | |||
| Question: Overall, do you approve or disapprove of the way Donald Trump handled his job when he was president? | |||
Vote choice is strongly related to job approval, with almost all who strongly or somewhat approve voting for Biden and over 90% of those who strongly disapprove voting for Trump.
In previous polls, Biden received a majority of votes among those who somewhat disapprove of the job he is doing, as shown in Table 22. However, in June, for the first time Trump leads with those somewhat disapproving of Biden’s handling of his job: 57% to 41%.
Table 22: Vote by Biden job approval Among registered voters
| Biden approval | Vote choice | |
| Joe Biden | Donald Trump | |
| 6/12-20/24 | ||
| Strongly approve | 100 | 0 |
| Somewhat approve | 98 | 2 |
| Somewhat disapprove | 41 | 57 |
| Strongly disapprove | 9 | 91 |
| 4/3-10/24 | ||
| Strongly approve | 100 | 0 |
| Somewhat approve | 96 | 3 |
| Somewhat disapprove | 56 | 43 |
| Strongly disapprove | 8 | 92 |
| 1/24-31/24 | ||
| Strongly approve | 94 | 5 |
| Somewhat approve | 95 | 5 |
| Somewhat disapprove | 50 | 44 |
| Strongly disapprove | 9 | 89 |
| 10/26-11/2/23 | ||
| Strongly approve | 100 | 0 |
| Somewhat approve | 94 | 4 |
| Somewhat disapprove | 57 | 38 |
| Strongly disapprove | 5 | 93 |
| Marquette Law School Poll, Wisconsin survey, latest: June 12-20, 2024 | ||
| Question: If the 2024 election for president were held today between [President Joe Biden, the Democrat,] and [former President Donald Trump, the Republican,] would you vote for [Joe Biden] or for [Donald Trump] or haven’t you decided? | ||
The relationship between approval of how Trump handled his job as president and vote preference is shown in Table 23. In both April and June, Trump loses the majority of those who somewhat disapprove of the job he did as president and almost all of those who strongly disapprove. Conversely, he wins almost all of those who either strongly or somewhat approve of how he handled the presidency.
Table 23: Vote by Trump job approval Among registered voters
| Trump approval | Vote choice | |
| Joe Biden | Donald Trump | |
| 6/12-20/24 | ||
| Strongly approve | 0 | 100 |
| Somewhat approve | 4 | 94 |
| Somewhat disapprove | 63 | 36 |
| Strongly disapprove | 98 | 2 |
| 4/3-10/24 | ||
| Strongly approve | 1 | 99 |
| Somewhat approve | 7 | 92 |
| Somewhat disapprove | 59 | 40 |
| Strongly disapprove | 95 | 4 |
| Marquette Law School Poll, Wisconsin survey, latest: June 12-20, 2024 | ||
| Question: If the 2024 election for president were held today between [President Joe Biden, the Democrat,] and [former President Donald Trump, the Republican,] would you vote for [Joe Biden] or for [Donald Trump] or haven’t you decided? | ||
Characteristics of Biden and Trump
Table 24 shows how well various phrases describe Biden and Trump.
- “Has behaved corruptly”: 61% say this describes Trump, 46% say this describes Biden.
- “Has the right temperament to be president”: 40% say this describes Trump, 52% say this describes Biden.
- “Is too old to be president”: 53% say this describes Trump, 76% say this describes Biden.
- “Shares your values”: 44% say this describes Trump, 43% say this describes Biden.
- “Has a strong record of accomplishment as president”: 52% say this describes Trump, 43% say this describes Biden
Table 24: How well does this phrase describe Biden or Trump Among registered voters
| Poll dates | How well phrase describes | |||
| Biden | Trump | |||
| Very/somewhat well | Not too/not at all well | Very/somewhat well | Not too/not at all well | |
| Has behaved corruptly | ||||
| 6/12-20/24 | 46 | 53 | 61 | 39 |
| 4/3-10/24 | 47 | 53 | 61 | 38 |
| 1/24-31/24 | 49 | 50 | 67 | 32 |
| 10/26-11/2/23 | 47 | 52 | 67 | 32 |
| Has the right temperament to be president | ||||
| 6/12-20/24 | 52 | 48 | 40 | 60 |
| 4/3-10/24 | 52 | 48 | 41 | 59 |
| Is too old to be president | ||||
| 6/12-20/24 | 76 | 24 | 53 | 46 |
| 4/3-10/24 | 80 | 18 | 58 | 41 |
| 1/24-31/24 | 82 | 17 | 56 | 44 |
| 10/26-11/2/23 | 77 | 22 | 54 | 45 |
| Shares your values | ||||
| 6/12-20/24 | 43 | 57 | 44 | 56 |
| 4/3-10/24 | 48 | 52 | 45 | 55 |
| 1/24-31/24 | 46 | 53 | 42 | 58 |
| 10/26-11/2/23 | 46 | 54 | 42 | 58 |
| Strong record of accomplishments as president | ||||
| 6/12-20/24 | 43 | 57 | 52 | 48 |
| 4/3-10/24 | 44 | 56 | 58 | 42 |
| 1/24-31/24 | 43 | 57 | 52 | 48 |
| 10/26-11/2/23 | 41 | 58 | 50 | 50 |
| Marquette Law School Poll, Wisconsin survey, latest: June 12-20, 2024 | ||||
| Question: How well does each of the following phrases describe (Joe Biden)(Donald Trump)? | ||||
Direction of the state and country, economic conditions, and personal financial situation
A majority (55%) of registered voters say Wisconsin is on the wrong track, while 45% say it is headed in the right direction. In April, 59% said the state was on the wrong track and 41% said it was headed in the right direction. The trend for this opinion is shown in Table 25.
Table 25: Right direction or wrong track Among registered voters
| Poll dates | Direction of state | ||
| Right direction | Wrong track | Don’t know | |
| 6/12-20/24 | 45 | 55 | 0 |
| 4/3-10/24 | 41 | 59 | 0 |
| 1/24-31/24 | 42 | 57 | 0 |
| 10/26-11/2/23 | 36 | 62 | 2 |
| Marquette Law School Poll, Wisconsin survey, latest: June 12-20, 2024 | |||
| Question: Thinking just about the state of Wisconsin, do you feel things in Wisconsin are generally going in the right direction, or do you feel things have gotten off on the wrong track? | |||
The national economy is seen as excellent by only 4%, as good by 30%, as not so good by 34%, and as poor by 32%. Views of the economy have fluctuated modestly since November 2023, as shown in Table 26.
Table 26: Views of the national economy Among registered voters
| Poll dates | National economy | |||
| Excellent | Good | Not so good | Poor | |
| 6/12-20/24 | 4 | 30 | 34 | 32 |
| 4/3-10/24 | 5 | 28 | 38 | 28 |
| 1/24-31/24 | 6 | 32 | 34 | 28 |
| 10/26-11/2/23 | 3 | 24 | 36 | 37 |
| Marquette Law School Poll, Wisconsin survey, latest: June 12-20, 2024 | ||||
| Question: How would you describe the state of the nation’s economy these days? | ||||
Respondents see the Wisconsin economy as better than the national economy. The comparison is shown in Table 27.
Table 27: Wisconsin economy vs. national economy Among registered voters
| State or national | View of economy | |||
| Excellent | Good | Not so good | Poor | |
| Wisconsin economy | 4 | 41 | 38 | 16 |
| National economy | 4 | 30 | 34 | 32 |
| Marquette Law School Poll, Wisconsin survey, June 12-20, 2024 | ||||
| Question: How would you describe the state of the Wisconsin economy these days? | ||||
| Question: How would you describe the state of the nation’s economy these days? | ||||
Respondents’ family financial situation is mixed: 46% say they are living comfortably, 37% say they are just getting by, and 17% say they are struggling. That is a 1-point increase in “living comfortably” but a 2-point increase in “struggling” since April. This trend is shown in Table 28.
Table 28: Family financial situation Among registered voters
| Poll dates | Financial situation | ||
| Living comfortably | Just getting by | Struggling | |
| 6/12-20/24 | 46 | 37 | 17 |
| 4/3-10/24 | 45 | 40 | 15 |
| 1/24-31/24 | 49 | 38 | 13 |
| 10/26-11/2/23 | 48 | 36 | 15 |
| Marquette Law School Poll, Wisconsin survey, latest: June 12-20, 2024 | |||
| Question: Thinking about your family’s financial situation, would you say you are living comfortably, just getting by, or struggling to make ends meet? | |||
State Issues: Education
Satisfaction with public schools has declined from the previous measure in November 2023. In the June poll, 7% were very satisfied with the public schools in their community, 39% were satisfied, while 24% were dissatisfied and 17% were very dissatisfied. A larger than usual 13% said they don’t know. In November 2023, 12% were very satisfied, 51% were satisfied, 25% were dissatisfied, and 10% were very dissatisfied, with 2% who said they didn’t know. Restating the results to exclude from the calculation those who say they don’t know yields the following results (and relative to November 2023): in June 2024, satisfaction with schools declined to 8% (from 12%) who are very satisfied and 44% (from 52%) who are satisfied, while 27% (up from 26%) are dissatisfied and 20% (up from 11%) are very dissatisfied.
The rise in dissatisfaction is seen across all regions of the state, but especially in Milwaukee. Table 29 shows satisfaction with schools by region for June 2024 and November 2023. The table shows the results for those with an opinion about schools, excluding those who say they “don’t know.”
Table 29: Satisfaction with public schools by region Among registered voters
| Region | Satisfaction | |||
| Very satisfied | Satisfied | Dissatisfied | Very dissatisfied | |
| 6/12-20/24 | ||||
| MKE City | 2 | 20 | 41 | 37 |
| Rest of MKE region | 8 | 48 | 24 | 19 |
| MSN | 8 | 43 | 31 | 19 |
| GB/A | 10 | 45 | 29 | 16 |
| Rest of state | 9 | 47 | 24 | 19 |
| 10/26-11/2/23 | ||||
| MKE City | 3 | 44 | 36 | 17 |
| Rest of MKE region | 15 | 46 | 29 | 9 |
| MSN | 16 | 47 | 27 | 10 |
| GB/A | 11 | 61 | 16 | 13 |
| Rest of state | 10 | 58 | 23 | 9 |
| Marquette Law School Poll, Wisconsin survey, latest: June 12-20, 2024 | ||||
| Question: How satisfied are you with the job the public schools are doing in your community? Very satisfied, satisfied, dissatisfied, or very dissatisfied? | ||||
| Note: Excluding those without an opinion | ||||
Perceptions of how schools are performing are generally negative, although there is a strikingly high rate of “don’t know” responses, indicating that many people do not follow school affairs closely.
Respondents were asked if test scores in reading and math have gone up, stayed the same, or gone down; if absenteeism has gone up, stayed the same, or gone down; and if the gap in test scores between low- and high-income students has gone up, stayed the same, or gone down. The results are shown in Table 30.
Table 30: Opinion on whether school performance measures have gone up Among registered voters
| Performance measure | Has gone up, stayed same, gone down | |||
| Gone up | Stayed same | Gone down | Haven’t heard enough | |
| Reading test scores | 6 | 18 | 35 | 41 |
| Math test scores | 4 | 20 | 33 | 43 |
| Absenteeism from school | 30 | 18 | 7 | 45 |
| Gap in test scores for low- and high-income | 14 | 25 | 9 | 52 |
| Marquette Law School Poll, Wisconsin survey, June 12-20, 2024 | ||||
| Question: In the public schools in your community, over the last five years, would you say each of the following has gone up, stayed about the same, gone down, or haven’t you heard enough to say? | ||||
Table 31 shows which education policies are seen as having been successful or unsuccessful. As with performance measures, a quarter or more say they don’t know. Each of these policies is seen as more of a success than a failure.
Table 31: Which education policies have been successes or failures Among registered voters
| Education policy | Success or failure | ||||
| A complete success | Mostly a success | Mostly a failure | A complete failure | Don’t know | |
| School choice, including charter schools and vouchers to attend private schools | 12 | 38 | 16 | 9 | 24 |
| Equal opportunity for girls and women to take part in sports because of Title IX | 11 | 49 | 10 | 4 | 25 |
| Special education programs for those with disabilities | 7 | 50 | 14 | 2 | 26 |
| Teaching reading through sounding out words, called phonics | 13 | 47 | 6 | 3 | 31 |
| Marquette Law School Poll, Wisconsin survey, June 12-20, 2024 | |||||
| Question: How much of a success or failure would you say each of the following education policies has been? | |||||
Respondents see local school boards as the government institution most able to improve the quality of schools, though they see parents as more able to improve quality. The federal government is seen as least effective, with state government somewhat more able to improve schools. These results are shown in Table 32.
Table 32: How much can each of these do to improve quality of schools Among registered voters
| Institution | Can improve school quality | ||||
| A lot | Some | Only a little | Nothing at all | Don’t know | |
| Local school boards | 54 | 32 | 8 | 2 | 4 |
| State government | 45 | 36 | 11 | 4 | 4 |
| Federal government in Washington | 22 | 32 | 24 | 15 | 7 |
| Parents | 65 | 21 | 7 | 2 | 4 |
| Marquette Law School Poll, Wisconsin survey, June 12-20, 2024 | |||||
| Question: How much can each of the following do to improve the quality of schools? | |||||
State Issues: Water
A majority of registered voters say they are very or somewhat concerned about PFAS chemicals contaminating their water supply. Concern has increased slightly since 2022, while the number of those not concerned has declined, as shown in Table 33.
Table 33: Concern about PFAS trend Among registered voters
| Poll dates | Concern | ||||
| Very concerned | Somewhat concerned | Not too concerned | Not at all concerned | Don’t know | |
| 6/12-20/24 | 32 | 36 | 19 | 5 | 8 |
| 6/8-13/23 | 34 | 35 | 19 | 9 | 3 |
| 6/14-20/22 | 31 | 30 | 16 | 18 | 5 |
| Marquette Law School Poll, Wisconsin survey, latest: June 12-20, 2024 | |||||
| Question: How concerned are you about certain long-lasting chemicals, known as PFAS, contaminating your drinking water? Are you very concerned, somewhat concerned, not too concerned or not at all concerned? | |||||
In the June poll, 16% said they had heard a lot about PFAS contamination in their community, 42% heard a little, and 35% had heard nothing at all. How much a respondent heard about PFAS is strongly related to level of concern as shown in Table 34.
Table 34: Concern about PFAS, by how much heard Among registered voters
| Heard about PFAS | Concern about PFAS | ||||
| Very concerned | Somewhat concerned | Not too concerned | Not at all concerned | Don’t know | |
| A lot | 62 | 29 | 6 | 3 | 0 |
| A little | 30 | 45 | 20 | 3 | 1 |
| Nothing at all | 23 | 31 | 25 | 9 | 12 |
| Marquette Law School Poll, Wisconsin survey, June 12-20, 2024 | |||||
| Question: How concerned are you about certain long-lasting chemicals, known as PFAS, contaminating your drinking water? Are you very concerned, somewhat concerned, not too concerned or not at all concerned? | |||||
| Question: How much have you heard about PFAS contamination in your community? A lot, a little, or nothing at all? | |||||
People whose water comes from a private well are slightly less concerned about PFAS contamination than those with municipally owned water systems, though over 60% are concerned regardless of water source, as shown in Table 35.
Table 35: Concern about PFAS, by water source Among registered voters
| Water source | Concern about PFAS | ||||
| Very concerned | Somewhat concerned | Not too concerned | Not at all concerned | Don’t know | |
| Private well | 30 | 34 | 21 | 10 | 5 |
| Municipally owned water system | 32 | 38 | 19 | 3 | 7 |
| Marquette Law School Poll, Wisconsin survey, June 12-20, 2024 | |||||
| Question: How concerned are you about certain long-lasting chemicals, known as PFAS, contaminating your drinking water? Are you very concerned, somewhat concerned, not too concerned or not at all concerned? | |||||
| Question: Does your home’s water come from a private well or a municipally owned water system? | |||||
Water-quality issues are seen as a statewide concern by 62% of registered voters, while 16% say it is mainly a problem in isolated parts of the state and 22% say they don’t know.
Approval of governor
Table 36 shows the job approval ratings for Gov. Tony Evers. Evers’ approval is 51% and disapproval is 44%. In April, Evers’ approval was 52% and disapproval was 44%.
Table 36: Approval of governor Among registered voters
| Approval | ||||
| Approval of | Wave | Approve | Disapprove | Don’t know |
| Tony Evers | 6/12-20/24 | 51 | 44 | 6 |
| Tony Evers | 4/3-10/24 | 52 | 44 | 3 |
| Tony Evers | 1/24-31/24 | 51 | 44 | 5 |
| Tony Evers | 10/26-11/2/23 | 53 | 46 | 2 |
| Marquette Law School Poll, Wisconsin survey, latest: June 12-20, 2024 | ||||
| Question: Overall, do you approve or disapprove of the way Tony Evers is handling his job as Governor of Wisconsin? | ||||
Favorability of state elected officials
Favorability ratings of Evers, Sen. Ron Johnson, and Assembly Speaker Robin Vos are shown in Table 37. Speaker Vos is far less known statewide than the others.
Table 37: Favorability of state political figures Among registered voters
| Favorability to | Favorability | |||
| Favorable | Unfavorable | Haven’t heard enough | Don’t know | |
| Ron Johnson | 38 | 50 | 11 | 0 |
| Tony Evers | 51 | 43 | 6 | 0 |
| Robin Vos | 14 | 35 | 50 | 1 |
| Marquette Law School Poll, Wisconsin survey, June 12-20, 2024 | ||||
| Question: Do you have a favorable or unfavorable opinion of (INSERT NAME) or haven’t you heard enough about them yet? | ||||
About the Marquette Law School Poll
The Marquette Law School Poll is the most extensive statewide polling project in Wisconsin history. This survey was conducted June 12-20, 2024, interviewing 871 Wisconsin registered voters, with a margin of error of +/-4.6 percentage points. The sample contains 784 likely voters, i.e., those who say they are absolutely certain to vote in November, with a margin of error of +/-4.9 percentage points.
The survey was conducted with a hybrid sample of 637 respondents selected from the Wisconsin voter registration list, and 234 selected from the SSRS Opinion Panel, a sample drawn from postal addresses across the state and invited to take part in surveys online. The interview was conducted online with 769 respondents and by telephone with a live interviewer with 102. Full details of the methodology are contained in the methodology statement at the link below.
The partisan makeup of the sample is 31% Republican, 29% Democratic, and 40% independent. Since January 2020, the long-term partisan balance has been 30% Republican, 29% Democratic, and 40% independent.
The entire questionnaire, methodology statement, full results and breakdowns by demographic groups are available on the Marquette Law School Poll website.
Related Content


Polls
Legal News
- Milwaukee mayor condemns anti-Semitism, renews calls for justice
- Wisconsin Supreme Court says an order against an anti-abortion protester violated First Amendment
- Prosecutors charge second inmate in assault that left Wisconsin youth prison counselor brain-dead
- Wisconsin Elections Commission rejects recall attempt against state’s top Republican
- ‘Trailblazing’ jurist and civil rights leader sculpture to be unveiled in Madison
- Wisconsin joins coalition urging court to uphold FTC’s ban on deceptive TurboTax advertising
- Marquette Law School Poll survey of Wisconsin finds Biden and Trump tied
- Wisconsin Supreme Court seeks investigation after abortion draft order leaks
- Man sentenced for impersonating a federal officer and wire fraud
- Illinois man rejects deal to plead guilty to 7 murder charges in Highland Park 4th of July shooting
- Wisconsin Court: Man’s Fourth Amendment rights violated
- Judge allows disabled voters in Wisconsin to electronically vote from home
Case Digests
- Suppression of Evidence
- Condemnation Powers-“Pedestrian Way”
- Insurance-Statute of Limitations-Sanctions
- Ineffective Assistance of Counsel
- Ineffective Assistance of Counsel
- Evidence
- Seizure-Reasonable Suspicion-Jury Instructions
- Sentencing Guidelines
- Collective Action-Overtime Wages-Arbitration
- Sentencing Guidelines
- Delayed Disclosure-Mistrial Motion
- Sixth Amendment-Request for Jury Trial