

 Free Newsletter

Marquette Law School poll shows Haley ahead of Biden
By: WISCONSIN LAW JOURNAL STAFF//November 11, 2023//
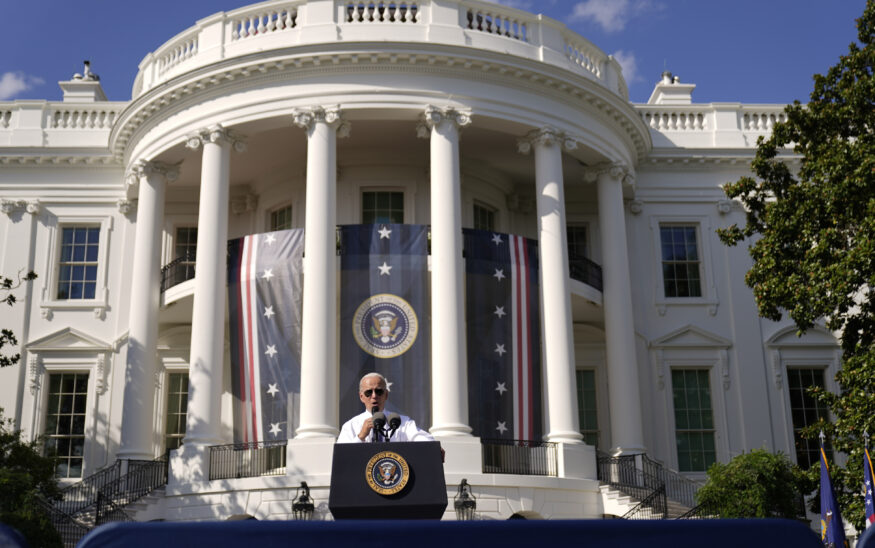
President Biden file photo.
Marquette Law School poll shows Haley ahead of Biden
By: WISCONSIN LAW JOURNAL STAFF//November 11, 2023//


By Marquette University News Center Staff
A Nov. 8 Marquette Law School Poll survey of Wisconsin registered voters finds Democratic President Joe Biden is the choice of 50% and former Republican President Donald Trump the choice of 48% of registered voters in a hypothetical head-to-head matchup looking to the November 2024 election for president. But Biden trails Republican candidates Florida Gov. Ron DeSantis and former South Carolina Gov. Nikki Haley in hypothetical matchups. DeSantis receives 50% to Biden’s 48%, while Haley holds a larger lead, 53% to Biden’s 44%. These results include initially undecided voters who were then asked to choose one of the candidates.
Table 1 shows the Biden vs. Trump results by party identification. Biden receives a higher share of Democratic votes than does Trump among Republicans, while independents split evenly. (All results in the tables are stated as percentages.)
Table 1: Vote for Biden or Trump
Among registered voters
| Party ID | Vote choice | ||
| Donald Trump | Joe Biden | Haven’t decided/Neither | |
| Total | 48 | 50 | 1 |
| Republican | 88 | 10 | 1 |
| Independent | 47 | 47 | 4 |
| Democrat | 6 | 94 | 0 |
| Marquette Law School Poll, Wisconsin survey, Oct. 26-Nov. 2, 2023 | |||
| Question: If the 2024 election for president were held today between former President Donald Trump, the Republican, and President Joe Biden, the Democrat, would you vote for Donald Trump or for Joe Biden or haven’t you decided? | |||
| Question for those initially answering “Haven’t decided”: If you had to choose, would you vote for Biden or for Trump? | |||
In the Biden-DeSantis matchup in Table 2, Republicans back DeSantis more strongly than they do Trump, while independents support DeSantis over Biden. Democratic support for Biden is little changed.
Table 2: Vote for Biden or DeSantis
Among registered voters
| Party ID | Vote choice | ||
| Ron DeSantis | Joe Biden | Haven’t decided | |
| Total | 50 | 48 | 1 |
| Republican | 91 | 7 | 2 |
| Independent | 58 | 37 | 5 |
| Democrat | 5 | 94 | 0 |
| Marquette Law School Poll, Wisconsin survey, Oct. 26-Nov. 2, 2023 | |||
| Question: If the 2024 election for president were held today between Florida Governor Ron DeSantis, the Republican, and President Joe Biden, the Democrat, would you vote for Ron DeSantis or for Joe Biden or haven’t you decided? | |||
| Question for those initially answering “Haven’t decided”: If you had to choose, would you vote for Biden or for DeSantis? | |||
Haley runs especially well against Biden in this survey, as shown in Table 3, winning a larger share of Republicans than DeSantis or Trump and matching DeSantis’ share of independent votes. She also wins 8% of Democratic voters, a larger share than does DeSantis or Trump.
Table 3: Vote for Biden or Haley
Among registered voters
| Party ID | Vote choice | ||
| Nikki Haley | Joe Biden | Haven’t decided | |
| Total | 53 | 44 | 3 |
| Republican | 94 | 4 | 2 |
| Independent | 58 | 31 | 11 |
| Democrat | 8 | 90 | 1 |
| Marquette Law School Poll, Wisconsin survey, Oct. 26-Nov. 2, 2023 | |||
| Question: If the 2024 election for president were held today between Former UN Ambassador Nikki Haley, the Republican, and President Joe Biden, the Democrat, would you vote for Nikki Haley or for Joe Biden or haven’t you decided? | |||
| Question for those initially answering “Haven’t decided”: If you had to choose, would you vote for Biden or for Haley? | |||
This Marquette Law School Poll was conducted from Oct. 26 through Nov. 2, 2023, interviewing 908 Wisconsin registered voters, with a margin of error of +/-4.5 percentage points. The sample includes 402 Republicans and independents who lean Republican who were asked about their preferences in the Republican presidential primary, with a margin of error of +/-6.8 percentage points.
Favorability
Haley’s strong showing comes despite her being the least well-known of the four candidates included in this poll. Among all registered voters, all four candidates—Biden, Trump, DeSantis, and Haley—are seen more unfavorably than favorably. Table 4 shows favorability to each. Trump has the highest net unfavorable opinion (favorable views minus unfavorable views), followed by Biden, DeSantis, and Haley, who is only slightly net negative. Haley has the highest percentage who say they haven’t heard enough about her or don’t know how they feel about her.
Table 4: Favorability to Biden, Trump, DeSantis, and Haley
Among registered voters
| Candidate | Favorability | ||||
| Net favorable | Favorable | Unfavorable | Haven’t heard enough | Don’t know | |
| Joe Biden | -14 | 42 | 56 | 2 | 0 |
| Donald Trump | -24 | 37 | 61 | 2 | 0 |
| Ron DeSantis | -12 | 37 | 49 | 13 | 0 |
| Nikki Haley | -3 | 31 | 34 | 33 | 2 |
| Marquette Law School Poll, Wisconsin survey, Oct. 26-Nov. 2, 2023 | |||||
| Question: Do you have a favorable or unfavorable opinion of (INSERT NAME) or haven’t you heard enough about them yet? | |||||
A significant share of respondents view both Biden and Trump unfavorably, 18%, while a smaller 12% view both Biden and DeSantis unfavorably, as do 12% for Biden and Haley.
A deeper look at votes
Biden vs. Trump, by 2020 vote
Voters were asked to recall whom they voted for in 2020, if they voted that year. For a rematch of Biden and Trump, there is strong stability of vote choice, with only 3% of Trump voters switching to Biden, 4% of Biden voters switching to Trump, and a handful who said they were undecided or who declined to answer, as shown in Table 5.
Table 5: Vote for Biden or Trump, by 2020 vote
Among registered voters who voted in 2020
| 2020 Vote | Vote choice in 2024 | |||
| Donald Trump | Joe Biden | Haven’t decided/Neither | Refused | |
| Donald Trump | 95 | 3 | 0 | 1 |
| Joe Biden | 4 | 94 | 2 | 1 |
| Marquette Law School Poll, Wisconsin survey, Oct. 26-Nov. 2, 2023 | ||||
| Question: If the 2024 election for president were held today between former President Donald Trump, the Republican, and President Joe Biden, the Democrat, would you vote for Donald Trump or for Joe Biden or haven’t you decided? | ||||
| Question for those initially answering “Haven’t decided”: If you had to choose, would you vote for Biden or for Trump? | ||||
| Question: Which presidential candidate did you vote for in 2020? | ||||
Comparing 2020 vote to the Biden vs. DeSantis matchup in Table 6 suggests that DeSantis holds a higher percentage of Trump voters than does Trump himself, while also winning over 9% of Biden 2020 voters.
Table 6: Vote for Biden or DeSantis, by 2020 vote
Among registered voters who voted in 2020
| 2020 Vote | Vote choice in 2024 | |||
| Ron DeSantis | Joe Biden | Haven’t decided | Refused | |
| Donald Trump | 97 | 3 | 0 | 0 |
| Joe Biden | 9 | 89 | 2 | 0 |
| Marquette Law School Poll, Wisconsin survey, Oct. 26-Nov. 2, 2023 | ||||
| Question: If the 2024 election for president were held today between Florida Governor Ron DeSantis, the Republican, and President Joe Biden, the Democrat, would you vote for Ron DeSantis or for Joe Biden or haven’t you decided? | ||||
| Question for those initially answering “Haven’t decided”: If you had to choose, would you vote for Biden or for DeSantis? | ||||
| Question: Which presidential candidate did you vote for in 2020? | ||||
Haley does especially well by winning over 15% of 2020 Biden voters and holding 96% of Trump 2020 voters, as shown in Table 7.
Table 7: Vote for Biden or Haley, by 2020 vote
Among registered voters who voted in 2020
| 2020 Vote | Vote choice in 2024 | |||
| Nikki Haley | Joe Biden | Haven’t decided | Refused | |
| Donald Trump | 96 | 3 | 1 | 0 |
| Joe Biden | 15 | 81 | 4 | 1 |
| Marquette Law School Poll, Wisconsin survey, Oct. 26-Nov. 2, 2023 | ||||
| Question: If the 2024 election for president were held today between former UN Ambassador Nikki Haley, the Republican, and President Joe Biden, the Democrat, would you vote for Nikki Haley or for Joe Biden or haven’t you decided? | ||||
| Question for those initially answering “Haven’t decided”: If you had to choose, would you vote for Biden or for Haley? | ||||
| Question: Which presidential candidate did you vote for in 2020? | ||||
Choice if “had to choose” among initially undecided voters
When initially asked their vote choice between Biden and Trump, 45% picked Biden and 42% chose Trump, while 12% said they were undecided. Table 8 shows the choices of the initially undecided voters when pushed to choose between Biden and Trump. These voters split very evenly between Biden and Trump.
Table 8: Vote if “had to choose,” among those initially undecided between Biden and Trump
Among registered voters who are undecided between Biden and Trump
| Biden v Trump | If had to choose | |||||
| Definitely Trump | Probably Trump | Probably Biden | Definitely Biden | Don’t know | Refused | |
| Undecided Biden or Trump | 6 | 40 | 39 | 6 | 7 | 3 |
| Marquette Law School Poll, Wisconsin survey, Oct. 26-Nov. 2, 2023 | ||||||
| Question: If you had to choose, would you vote for Biden or for Trump? | ||||||
When initially asked their vote choice between Biden and DeSantis, 43% picked Biden and 42% chose DeSantis, while 15% said they were undecided. Table 9 shows the choices of these initially undecided voters when pushed to choose between Biden and DeSantis. These voters favor DeSantis over Biden, though few are “definite” in their preferences.
Table 9: Vote if “had to choose,” among those undecided between Biden and DeSantis
Among registered voters who are undecided between Biden and DeSantis
| Biden v DeSantis | If had to choose | |||||
| Definitely DeSantis | Probably DeSantis | Probably Biden | Definitely Biden | Don’t know | Refused | |
| Undecided Biden or Trump | 7 | 49 | 34 | 0 | 9 | 0 |
| Marquette Law School Poll, Wisconsin survey, Oct. 26-Nov. 2, 2023 | ||||||
| Question: If you had to choose, would you vote for Biden or for DeSantis? | ||||||
When initially asked their vote choice between Biden and Haley, 36% picked Biden and 41% chose Haley, while 22% said they were undecided. Table 10 shows the choices of these initially undecided voters when pushed to choose between Biden and Haley. Haley picks up a majority of these undecided voters, with some remaining undecided.
Table 10: Vote if “had to choose,” among those undecided between Biden and Haley
Among registered voters who are undecided between Biden and Haley
| Biden v Haley | If had to choose | |||||
| Definitely Haley | Probably Haley | Probably Biden | Definitely Biden | Don’t know | Refused | |
| Undecided Biden or Trump | 8 | 45 | 35 | 0 | 11 | 1 |
| Marquette Law School Poll, Wisconsin survey, Oct. 26-Nov. 2, 2023 | ||||||
| Question: If you had to choose, would you vote for Biden or for Haley? | ||||||
Biden job approval and vote
Biden’s job approval stands at 42% with disapproval at 57%. In June, 45% approved and 53% disapproved.
Table 11 shows vote choice between Biden and Trump by Biden job approval. Biden wins very large majorities of those who approve either strongly or somewhat of how he is doing his job, but he also wins a majority of those who somewhat disapprove of his handling of his job. This provides him a boost against Trump. Trump wins more than 90% of the strongly disapprove group, as does each of the other Republican candidates.
Table 11: Biden vs. Trump vote, by Biden job approval
Among registered voters
| Biden job approval | Vote | ||
| Donald Trump | Joe Biden | Haven’t decided/Neither | |
| Total | 48 | 50 | 1 |
| Strongly approve | 0 | 100 | 0 |
| Somewhat approve | 4 | 94 | 1 |
| Somewhat disapprove | 38 | 57 | 3 |
| Strongly disapprove | 93 | 5 | 1 |
| Marquette Law School Poll, Wisconsin survey, Oct. 26-Nov. 2, 2023 | |||
| Question: If the 2024 election for president were held today between former President Donald Trump, the Republican, and President Joe Biden, the Democrat, would you vote for Donald Trump or for Joe Biden or haven’t you decided? | |||
| Question for those initially answering “Haven’t decided”: If you had to choose, would you vote for Biden or for Trump? | |||
| Question: Overall, do you approve or disapprove of the way Joe Biden is handling his job as president? | |||
Table 12 shows vote choice between Biden and DeSantis by Biden job approval. Biden continues to win big majorities from both categories of approval, but he holds a smaller majority among somewhat disapproving voters than he would win against Trump.
Table 12: Biden vs. DeSantis vote, by Biden job approval
Among registered voters
| Biden job approval | Vote | ||
| Ron DeSantis | Joe Biden | Haven’t decided | |
| Total | 50 | 48 | 1 |
| Strongly approve | 0 | 98 | 2 |
| Somewhat approve | 10 | 87 | 3 |
| Somewhat disapprove | 48 | 52 | 1 |
| Strongly disapprove | 94 | 5 | 1 |
| Marquette Law School Poll, Wisconsin survey, Oct. 26-Nov. 2, 2023 | |||
| Question: If the 2024 election for president were held today between Florida Governor Ron DeSantis, the Republican, and President Joe Biden, the Democrat, would you vote for Ron DeSantis or for Joe Biden or haven’t you decided? | |||
| Question for those initially answering “Haven’t decided”: If you had to choose, would you vote for Biden or for DeSantis? | |||
| Question: Overall, do you approve or disapprove of the way Joe Biden is handling his job as president? | |||
Table 13 shows vote choice between Biden and Haley by Biden job approval. Haley draws more voters from among Biden’s “somewhat approve” category and takes a substantial majority from the “somewhat disapprove” category—the only Republican candidate to do so.
Table 13: Biden vs. Haley vote, by Biden job approval
Among registered voters
| Biden job approval | Vote | ||
| Nikki Haley | Joe Biden | Haven’t decided | |
| Total | 53 | 44 | 3 |
| Strongly approve | 0 | 97 | 3 |
| Somewhat approve | 20 | 75 | 3 |
| Somewhat disapprove | 54 | 41 | 5 |
| Strongly disapprove | 93 | 6 | 2 |
| Marquette Law School Poll, Wisconsin survey, Oct. 26-Nov. 2, 2023 | |||
| Question: If the 2024 election for president were held today between former UN Ambassador Nikki Haley, the Republican, and President Joe Biden, the Democrat, would you vote for Nikki Haley or for Joe Biden or haven’t you decided? | |||
| Question for those initially answering “Haven’t decided”: If you had to choose, would you vote for Biden or for Haley? | |||
| Question: Overall, do you approve or disapprove of the way Joe Biden is handling his job as president? | |||
Possible 3rd party candidates
The possibility of independent candidacies by Robert F. Kennedy Jr. and by Cornel West has raised questions about their potential electoral strength and which of the major party candidates might lose more support to an independent candidate.
As the tables below show, Kennedy is much better liked by Republicans than by Democrats, and Republicans are much more likely to say they would definitely or probably vote for him if he were on the ballot in November. In contrast, a large proportion of Democrats say they would definitely not vote for Kennedy. Substantial proportions of independents and those undecided between the major party candidates say they might vote for Kennedy.
Robert F. Kennedy Jr. favorability and vote support
Kennedy is viewed favorably by 31%, and unfavorably by 39%, while 30% say they haven’t heard enough about him to have an opinion. Table 14 shows favorability to Kennedy by party identification. Kennedy is viewed much more favorably among Republicans than among Democrats, with independents less favorable than Republicans and considerably more likely to say they haven’t heard enough about Kennedy.
Table 14: Kennedy favorability, by party identification
Among registered voters
| Party ID | Favorability | |||
| Favorable | Unfavorable | Haven’t heard enough | Don’t know | |
| Total | 31 | 39 | 30 | 1 |
| Republican | 48 | 21 | 29 | 2 |
| Independent | 34 | 26 | 40 | 0 |
| Democrat | 11 | 61 | 27 | 1 |
| Marquette Law School Poll, Wisconsin survey, Oct. 26-Nov. 2, 2023 | ||||
| Question: Do you have a favorable or unfavorable opinion of Robert F. Kennedy Jr or haven’t you heard enough about them yet? | ||||
If Kennedy were to be included on the November ballot, 5% say they would definitely vote for him, 23% would probably vote for him, 29% would probably not vote for him, and 39% would definitely not vote for him. Table 15 shows potential support for Kennedy by party identification. Less than 10% of any partisan group say they would definitely vote for Kennedy, but 30% of Republicans and 36% of independents say they would probably vote for him. Only 4% of Democrats would definitely support Kennedy and 13% would probably support him.
Table 15: Consider voting for Kennedy, by party identification
Among registered voters
| Party ID | Vote for Kennedy | ||||
| Definitely vote for Kennedy | Probably vote for Kennedy | Probably not vote for Kennedy | Definitely not vote for Kennedy | Don’t know | |
| Total | 5 | 23 | 29 | 39 | 3 |
| Republican | 6 | 30 | 37 | 25 | 3 |
| Independent | 8 | 36 | 26 | 22 | 6 |
| Democrat | 4 | 13 | 23 | 60 | 1 |
| Marquette Law School Poll, Wisconsin survey, Oct. 26-Nov. 2, 2023 | |||||
| Question: If Robert F. Kennedy Jr. is on the presidential ballot as an independent candidate, how likely would you be to vote for him instead of the Democratic or Republican candidates? | |||||
Table 16 shows potential vote for Kennedy by initial vote between Biden and Trump (with initial “Haven’t decided voters” listed separately in this table). Kennedy draws more “definite” and “probably” support from Trump voters than from Biden voters, while those undecided show a higher inclination to consider Kennedy. Few, however, are definite in their support for Kennedy.
Table 16: Consider voting for Kennedy, by initial Biden-Trump choice
Among registered voters
| Initial Biden-Trump vote | Vote for Kennedy | ||||
| Definitely vote for Kennedy | Probably vote for Kennedy | Probably not vote for Kennedy | Definitely not vote for Kennedy | Don’t know | |
| Total | 5 | 23 | 29 | 39 | 3 |
| Donald Trump | 6 | 29 | 38 | 24 | 3 |
| Joe Biden | 3 | 14 | 21 | 60 | 2 |
| Haven’t decided | 11 | 33 | 33 | 20 | 3 |
| Marquette Law School Poll, Wisconsin survey, Oct. 26-Nov. 2, 2023 | |||||
| Question: If Robert F. Kennedy Jr. is on the presidential ballot as an independent candidate, how likely would you be to vote for him instead of the Democratic or Republican candidates? | |||||
Table 17 shows Kennedy support by Biden vs. DeSantis initial vote choice. The results are similar to those for the Biden vs. Trump table above, with Kennedy appearing more attractive to DeSantis voters than to Biden voters, while most attractive to those who are initially undecided between Biden and DeSantis.
Table 17: Consider voting for Kennedy, by initial Biden-DeSantis choice
Among registered voters
| Biden-DeSantis vote | Vote for Kennedy | ||||
| Definitely vote for Kennedy | Probably vote for Kennedy | Probably not vote for Kennedy | Definitely not vote for Kennedy | Don’t know | |
| Total | 5 | 23 | 29 | 39 | 3 |
| Ron DeSantis | 5 | 29 | 36 | 27 | 2 |
| Joe Biden | 4 | 11 | 22 | 62 | 1 |
| Haven’t decided | 11 | 43 | 30 | 10 | 7 |
| Marquette Law School Poll, Wisconsin survey, Oct. 26-Nov. 2, 2023 | |||||
| Question: If Robert F. Kennedy Jr. is on the presidential ballot as an independent candidate, how likely would you be to vote for him instead of the Democratic or Republican candidates? | |||||
Possible support for Kennedy by initial choice between Biden and Haley is shown in Table 18. The results are also similar to those for DeSantis and Trump, with Haley voters more likely to consider Kennedy than are Biden voters.
Table 18: Consider voting for Kennedy, by initial Biden-Haley choice
Among registered voters
| Biden-Haley vote | Vote for Kennedy | ||||
| Definitely vote for Kennedy | Probably vote for Kennedy | Probably not vote for Kennedy | Definitely not vote for Kennedy | Don’t know | |
| Total | 5 | 23 | 29 | 39 | 3 |
| Nikki Haley | 6 | 29 | 33 | 29 | 2 |
| Joe Biden | 2 | 9 | 24 | 64 | 1 |
| Haven’t decided | 8 | 36 | 31 | 20 | 5 |
| Marquette Law School Poll, Wisconsin survey, Oct. 26-Nov. 2, 2023 | |||||
| Question: If Robert F. Kennedy Jr. is on the presidential ballot as an independent candidate, how likely would you be to vote for him instead of the Democratic or Republican candidates? | |||||
Cornel West favorability
West is less well known than Kennedy, with 69% saying they haven’t heard enough about West to have an opinion. There is very little variation in favorability to West across party identification categories, as shown in Table 19.
Table 19: West favorability, by party identification
Among registered voters
| Party ID | Favorability | |||
| Favorable | Unfavorable | Haven’t heard enough | Don’t know | |
| Total | 6 | 20 | 69 | 5 |
| Republican | 6 | 21 | 68 | 6 |
| Independent | 8 | 14 | 71 | 7 |
| Democrat | 6 | 21 | 69 | 4 |
| Marquette Law School Poll, Wisconsin survey, Oct. 26-Nov. 2, 2023 | ||||
| Question: Do you have a favorable or unfavorable opinion of Cornel West, or haven’t you heard enough about them yet? | ||||
Perceptions of Biden and Trump
Table 20 shows whether Biden or Trump is thought to do a better job on six issues. Trump is seen as better on immigration and border security, the economy, and, to a smaller degree, foreign relations. Biden is seen as slightly better on Medicare and Social Security, with a larger advantage on abortion policy and especially on climate change.
A substantial percentage say both candidates would be about the same or that neither would be good on each issue. These voters could change their minds over the course of the campaign, providing an opportunity for change in these perceptions.
Table 20: Which candidate would do a better job on issues
Among registered voters
| Issue | Who better | ||||
| Biden | Trump | Both about the same | Neither good | Don’t know | |
| Immigration and border security | 30 | 50 | 7 | 13 | 0 |
| The economy | 33 | 50 | 8 | 9 | 0 |
| Foreign relations | 39 | 44 | 5 | 12 | 0 |
| Medicare and Social Security | 41 | 37 | 12 | 10 | 1 |
| Abortion policy | 43 | 34 | 9 | 14 | 0 |
| Climate change | 45 | 28 | 10 | 16 | 1 |
| Marquette Law School Poll, Wisconsin survey, Oct. 26-Nov. 2, 2023 | |||||
| Question: Do you think Joe Biden or Donald Trump would do a better job handling each of the following issues, they are both about the same or would neither be good on the issue? | |||||
Table 21 shows opinions on how well various phrases describe Biden and Trump. Biden particularly is seen as “too old to be president” compared to those who see Trump as too old. The column “Net describes” is the percent saying this describes the candidate very or somewhat well, minus the percent saying it does so not too well or not at all well. On age, a net 55% say this describes Biden, while a net 9% say this describes Trump.
On “shares your values,” slightly more say this describes Trump very well than Biden, but more are emphatic that this does not describe Trump for them than is the case for Biden. The net figure shows a small advantage to Biden over Trump, though more say each candidate does not share their values.
Corruption charges have been leveled against both candidates, but more people think “has behaved corruptly” does not describe Biden than think it does, while the “net” for Trump is +35, showing 35% more think this describes him than think this does not describe Trump.
On their records of accomplishment as president, Trump has a net of 0, showing equal numbers of people think “a strong record of accomplishment” describes him and think this does not describe him. For Biden, the net score is -17, showing more people don’t see a record of accomplishment by Biden than think he does have such a record.
Table 21: How well does this phrase describe Biden or Trump
Among registered voters
| Issue | How well phrase describes | ||||
| Net describes | Very well | Somewhat well | Not too well | Not at all well | |
| Is too old to be president | |||||
| Biden | 55 | 55 | 22 | 11 | 11 |
| Trump | 9 | 25 | 29 | 24 | 21 |
| Shares your values | |||||
| Biden | -8 | 18 | 28 | 15 | 39 |
| Trump | -16 | 22 | 20 | 11 | 47 |
| Has behaved corruptly | |||||
| Biden | -5 | 31 | 16 | 16 | 36 |
| Trump | 35 | 50 | 17 | 12 | 20 |
| Strong record of accomplishments as president | |||||
| Biden | -17 | 20 | 21 | 18 | 40 |
| Trump | 0 | 33 | 17 | 15 | 35 |
| Marquette Law School Poll, Wisconsin survey, Oct. 26-Nov. 2, 2023 | |||||
| Question: How well does each of the following phrases describe (Joe Biden)(Donald Trump)? | |||||
| “Net describes” column is ‘very well’ plus ‘somewhat well’ minus ‘not too well’ minus ‘not at all well’ | |||||
Republican primary
Trump leads DeSantis in the GOP primary, with Haley in third place. Since June, Trump and Haley have gained support while DeSantis has declined substantially. Former Vice President Mike Pence suspended his campaign while the survey was being conducted. No candidate other than Trump, DeSantis, and Haley receives more than 3% support. Table 22 shows the full set of GOP primary preferences.
Table 22: Republican primary vote choice
Among Republican registered voters
| Primary choice | Survey wave | |
| 10/26-11/2/23 | 6/8-13/23 | |
| Donald Trump | 38 | 31 |
| Ron DeSantis | 18 | 30 |
| Nikki Haley | 11 | 3 |
| Vivek Ramaswamy | 3 | 3 |
| Mike Pence | 3 | 6 |
| Chris Christie | 1 | 1 |
| Tim Scott | 1 | 5 |
| Doug Burgum | 1 | 0 |
| Asa Hutchinson | 0 | 0 |
| Larry Elder | 0 | 0 |
| Haven’t decided | 24 | 21 |
| Marquette Law School Poll, Wisconsin survey, Oct. 26-Nov. 2, 2023 | ||
| Question: Here are some candidates for the Republican presidential nomination. If the primary were today, whom would you vote for or haven’t you decided? | ||
| Note: Mike Pence suspended his campaign while the survey was being conducted. | ||
Favorability of Trump, DeSantis, and Haley among Republican registered voters
Table 23 shows favorability to the three leading Republican candidates among Republican registered voters. All three candidates are viewed more favorably than unfavorably among Republican voters, though it is notable that DeSantis and especially Haley are still not universally known.
Table 23: Favorability to Trump, DeSantis and Haley among Republicans
Among Republican registered voters
| Candidate | Favorability | |||
| Favorable | Unfavorable | Haven’t heard enough | Don’t know | |
| Donald Trump | 69 | 28 | 3 | 0 |
| Ron DeSantis | 73 | 15 | 11 | 1 |
| Nikki Haley | 54 | 18 | 27 | 2 |
| Marquette Law School Poll, Wisconsin survey, Oct. 26-Nov. 2, 2023 | ||||
| Question: Do you have a favorable or unfavorable opinion of (INSERT NAME) or haven’t you heard enough about them yet? | ||||
Wisconsin topics
Right direction or wrong track
A majority of registered voters (62%) say the state is on the wrong track, while 36% say it is headed in the right direction. A slight majority of Democrats see the state headed in the right direction, while large majorities of independents and Republicans say the state is on the wrong track, as shown in Table 24.
Table 24: Right direction or wrong track by party identification
Among registered voters
| Party ID | Direction of the state | |
| Right direction | Wrong track | |
| Total | 36 | 62 |
| Republican | 19 | 79 |
| Independent | 31 | 69 |
| Democrat | 54 | 43 |
| Marquette Law School Poll, Wisconsin survey, Oct. 26-Nov. 2, 2023 | ||
| Question: Thinking just about the state of Wisconsin, do you feel things in Wisconsin are generally going in the right direction, or do you feel things have gotten off on the wrong track? | ||
Approval of governor, legislature, and state Supreme Court
Table 25 shows the approval ratings for Gov. Tony Evers, the Wisconsin legislature, and the Wisconsin Supreme Court. Evers’ approval is 53% and disapproval is 46%. In June, Evers’ approval was 57% and disapproval was 39%. The legislature and state Supreme Court were not measured in June.
Table 25: Approval of governor, the legislature, and state Supreme Court
Among registered voters
| Approval of: | Approval | ||
| Approve | Disapprove | Don’t know | |
| Tony Evers | 53 | 46 | 2 |
| The Wisconsin legislature | 40 | 57 | 3 |
| The Wisconsin state Supreme Court | 51 | 43 | 5 |
| Marquette Law School Poll, Wisconsin survey, Oct. 26-Nov. 2, 2023 | |||
| Question: Overall, do you approve or disapprove of the way Tony Evers is handling his job as Governor of Wisconsin? | |||
| Question: Overall, do you approve or disapprove of the way the Wisconsin legislature is handling its job? | |||
| Question: Overall, do you approve or disapprove of the way the Wisconsin state Supreme Court is handling its job? | |||
Favorability of state elected officials
Favorability ratings of Sen. Tammy Baldwin and Sen. Ron Johnson, Evers, and State Assembly Speaker Robin Vos are shown in Table 26. Vos is far less known statewide than are the others.
Table 26: Favorability to state elected officials
Among registered voters
| Elected official | Favorability | |||
| Favorable | Unfavorable | Haven’t heard enough | Don’t know | |
| Tammy Baldwin | 41 | 43 | 15 | 1 |
| Ron Johnson | 40 | 50 | 10 | 1 |
| Tony Evers | 50 | 42 | 7 | 1 |
| Robin Vos | 16 | 36 | 46 | 2 |
| Marquette Law School Poll, Wisconsin survey, Oct. 26-Nov. 2, 2023 | ||||
| Question: Do you have a favorable or unfavorable opinion of (INSERT NAME) or haven’t you heard enough about them yet? | ||||
Supreme Court elections, redistricting and impeachment
Wisconsin Supreme Court election races have become much more partisan and competitive in recent years. A large majority of registered voters, 87%, say they prefer a system with elected state Supreme Court justices, while 12% would prefer to have appointed Supreme Court justices. Table 27 shows preference for election or appointment by party identification. There are small party differences, with large majorities favoring elected justices in each partisan group.
Table 27: Prefer elected or appointed state Supreme Court justices
Among registered voters
| Party ID | Preference | ||
| Better to have justices be elected | Better to have justices be appointed | Don’t know | |
| Total | 87 | 12 | 1 |
| Republican | 84 | 14 | 2 |
| Independent | 89 | 10 | 0 |
| Democrat | 90 | 10 | 0 |
| Marquette Law School Poll, Wisconsin survey, Oct. 26-Nov. 2, 2023 | |||
| Question: Some states appoint state Supreme Court justices, and other states elect them. Do you think it is better to have state Supreme Court justices appointed or to have justices elected? | |||
A similar majority of respondents, 80%, say that judicial candidates should talk about issues so voters know where they stand, while 19% say candidates should avoid talking about issues to avoid seeming to prejudge issues that might come before them. These results are shown by party in Table 28
Table 28: Should judicial candidates talk about issues during campaigns
Among registered voters
| Party ID | Preference | |
| Discuss issues | Avoid discussing issues | |
| Total | 80 | 19 |
| Republican | 71 | 29 |
| Independent | 80 | 19 |
| Democrat | 90 | 10 |
| Marquette Law School Poll, Wisconsin survey, Oct. 26-Nov. 2, 2023 | ||
| Question: Should judicial candidates discuss during campaigns issues likely to come before them if elected so voters know what the candidates stand for, or should they avoid talking about such issues in order not to seem to be pre-judging the issues? | ||
A case currently before the state Supreme Court could result in redrawing state legislative districts before the 2024 elections. A slight majority, 51%, say the current maps should remain in place until the next scheduled redistricting in 2031, while 45% want the maps redrawn now, and 4% say they don’t know. Opinion on this issue divides strongly along partisan lines, as shown in Table 29.
Table 29: Opinion on redistricting legislature now or in 2031
Among registered voters
| Party ID | Preference | ||
| Redraw district maps | Keep maps in place | Don’t know | |
| Total | 45 | 51 | 4 |
| Republican | 19 | 76 | 4 |
| Independent | 42 | 55 | 3 |
| Democrat | 73 | 23 | 4 |
| Marquette Law School Poll, Wisconsin survey, Oct. 26-Nov. 2, 2023 | |||
| Question: A case currently before the state Supreme Court could require maps of the legislative districts for the state Senate and Assembly to be redrawn for upcoming elections. Do you favor redrawing the district maps or should the maps created prior to the 2022 elections remain in place until the next scheduled redistricting in 2031? | |||
Earlier in the fall Republican legislators discussed the possibility of impeaching newly elected state Supreme Court Justice Janet Protasiewicz, though they have not moved forward with such an action. Among registered voters, 31% have heard a lot about a possible impeachment, 39% have heard a little, and 29% have heard nothing at all about this. Table 30 shows this by party, with Democrats more than twice as likely as Republicans to have heard a lot about a possible impeachment.
Table 30: How much have you heard about possible impeachment of Justice Protasiewicz
Among registered voters
| Party ID | Amount heard or read | |||
| A lot | A little | Nothing at all | Don’t know | |
| Total | 31 | 39 | 29 | 1 |
| Republican | 20 | 44 | 34 | 1 |
| Independent | 20 | 45 | 35 | 0 |
| Democrat | 46 | 32 | 23 | 0 |
| Marquette Law School Poll, Wisconsin survey, Oct. 26-Nov. 2, 2023 | ||||
| Question: How much have you heard or read about calls by some Republican legislators to consider impeaching state Supreme Court Justice Janet Protasiewicz? | ||||
Aid to Ukraine and Israel and U.S. role in the world
In Wisconsin, 62% think it is better for the country if the U.S. plays an active role in world affairs, while 36% say it would be better to stay out of world affairs. Table 31 shows how these views differ by party identification. Independents are most likely to say the U.S. should stay out of world affairs. A small majority of Republicans say the U.S. should play an active part in the world, while 75% of Democrats favor an active role in the world.
Table 31: Better for U.S. to play active role in world or to stay out of world affairs
Among registered voters
| Party ID | Role in world | ||
| Take an active part in world affairs | Stay out of world affairs | Don’t know | |
| Total | 62 | 36 | 1 |
| Republican | 53 | 46 | 1 |
| Independent | 47 | 49 | 1 |
| Democrat | 75 | 23 | 2 |
| Marquette Law School Poll, Wisconsin survey, Oct. 26-Nov. 2, 2023 | |||
| Question: Do you think it will be better for the future of the country if we take an active part in world affairs, or if we stay out of world affairs? | |||
Twenty-eight percent says the U.S. is providing too much support to Israel in its war with Hamas in Gaza, while 23% say the U.S. is not giving enough support for Israel and 46% say about the right amount of support is being given to Israel. Table 32 shows how views of aid to Israel vary by party. Democrats are more likely to say the U.S. is giving too much support to Israel than are Republicans.
Table 32: Amount of U.S. support to Israel, by party identification
Among registered voters
| Party ID | Support to Israel | |||
| Too much support | Not enough support | About the right amount of support | Don’t know | |
| Total | 28 | 23 | 46 | 3 |
| Republican | 18 | 32 | 45 | 4 |
| Independent | 29 | 28 | 39 | 4 |
| Democrat | 37 | 12 | 50 | 1 |
| Marquette Law School Poll, Wisconsin survey, Oct. 26-Nov. 2, 2023 | ||||
| Question: When it comes to Israel’s war with Hamas in Gaza, do you think the United States is providing too much support to Israel, not enough support to Israel, or about the right amount of support to Israel? | ||||
Asked about support for aid to Ukraine, 36% say the U.S. is giving too much support to Ukraine, 22% say not enough support is being given, and 41% say the amount of support is about right. Party differences on aid to Ukraine are the reverse of those for aid to Israel, with Republicans most likely to say too much support is being given to Ukraine and Democrats least likely to say this, as shown in Table 33.
Table 33: Amount of U.S. support to Ukraine, by party identification
Among registered voters
| Party ID | Support to Ukraine | |||
| Too much support | Not enough support | About the right amount of support | Don’t know | |
| Total | 36 | 22 | 41 | 1 |
| Republican | 55 | 13 | 29 | 2 |
| Independent | 43 | 20 | 36 | 1 |
| Democrat | 12 | 31 | 55 | 1 |
| Marquette Law School Poll, Wisconsin survey, Oct. 26-Nov. 2, 2023 | ||||
| Question: When it comes to Russia’s invasion of Ukraine, do you think the United States is providing too much support to Ukraine, not enough support to Ukraine, or about the right amount of support to Ukraine? | ||||
Views of the economy and personal financial situation
The national economy is seen as excellent by only 3%, as good by 24%, as not so good by 36%, and as poor by 37%. These views of the economy differ sharply by party identification, as shown in Table 34.
Table 34: Views of the national economy, by party identification
Among registered voters
| Party ID | Description of national economy | |||
| Excellent | Good | Not so good | Poor | |
| Total | 3 | 24 | 36 | 37 |
| Republican | 0 | 4 | 34 | 61 |
| Independent | 0 | 19 | 38 | 43 |
| Democrat | 7 | 47 | 37 | 9 |
| Marquette Law School Poll, Wisconsin survey, Oct. 26-Nov. 2, 2023 | ||||
| Question: How would you describe the state of the nation’s economy these days? | ||||
Among registered voters, 48% say they are living comfortably, while 36% say they are just getting by and 15% say they are struggling. Partisan differences in personal financial situation are shown in Table 35.
Table 35: Family financial situation, by party identification
Among registered voters
| Party ID | Family financial situation | ||
| Living comfortably | Just getting by | Struggling | |
| Total | 48 | 36 | 15 |
| Republican | 42 | 41 | 17 |
| Independent | 29 | 40 | 31 |
| Democrat | 60 | 31 | 9 |
| Marquette Law School Poll, Wisconsin survey, Oct. 26-Nov. 2, 2023 | |||
| Question: Thinking about your family’s financial situation, would you say you are living comfortably, just getting by, or struggling to make ends meet? | |||
Abortion opinion
A majority, 57%, oppose the U.S. Supreme Court’s decision in 2022 that overturned Roe v. Wade, while 35% favor that decision. Table 36 shows opinion by party, with a majority of Republicans in favor of overturning Roe while majorities of independents and Democrats are opposed.
Table 36: Favor or oppose overturning Roe v. Wade, by party identification
Among registered voters
| Party ID | Overturning Roe v. Wade | ||
| Favor | Oppose | Haven’t heard of decision | |
| Total | 35 | 57 | 6 |
| Republican | 66 | 26 | 5 |
| Independent | 27 | 60 | 10 |
| Democrat | 5 | 89 | 6 |
| Marquette Law School Poll, Wisconsin survey, Oct. 26-Nov. 2, 2023 | |||
| Question: Do you favor or oppose the recent U.S. Supreme Court decision to overturn Roe versus Wade, thus striking down the 1973 decision that made abortion legal in all 50 states? | |||
Abortion remains one of the most important issues among Democrats, though less so among Republicans and independents, as shown in Table 37.
Table 37: Importance of the abortion issue by party identification
Among registered voters
| Party ID | Importance of abortion issue | |||
| One of the most important issues | Somewhat important | Not very important | Not at all important | |
| Total | 38 | 42 | 13 | 6 |
| Republican | 28 | 42 | 19 | 11 |
| Independent | 19 | 59 | 18 | 4 |
| Democrat | 55 | 37 | 6 | 1 |
| Marquette Law School Poll, Wisconsin survey, Oct. 26-Nov. 2, 2023 | ||||
| Question: How important is the abortion issue to you–would you say it is one of the most important, somewhat important, not very important, or not important at all? | ||||
About the Marquette Law School Poll
The Marquette Law School Poll is the most extensive statewide polling project in Wisconsin history. This survey was conducted Oct. 26-Nov. 2, 2023, interviewing 908 Wisconsin registered voters, with a margin of error of +/-4.5 percentage points. The sample includes 402 Republicans and independents who lean Republican who were asked about their preferences in the Republican presidential primary, with a margin of error of +/-6.8 percentage points.
The survey was conducted with a hybrid sample of 690 respondents selected from the Wisconsin voter registration list and 218 selected from the SSRS Opinion Panel, a sample drawn from postal addresses across the state and invited to take part in surveys online. Interviews were conducted online with 693 respondents, while 215 interviews were conducted by telephone with a live interviewer. Full details of the methodology are contained in the methodology statement at the link below.
The partisan makeup of the sample is 30% Republican, 29% Democratic, and 41% independent. Since January 2020, the long-term partisan balance has been 30% Republican and 28% Democratic, with 41% independent.
The entire questionnaire, methodology statement, full results, and breakdowns by demographic groups are available on the Marquette Law Poll website.
Related Content


Polls
Legal News
- Applicants wanted for Jefferson County, Crawford County circuit courts
- Wisconsin wedding barns sue over state’s new liquor law requiring licensing
- Audit launched of Wisconsin’s diversity efforts
- Federal appeals court approves high-voltage power line through Mississippi River refuge
- Dane County residents encouraged to weigh how to spend federal funds
- Jurors should have considered stand-your-ground defense in sawed-off shotgun killing, judges rule
- Money isn’t enough to smooth the path for Republican candidates hoping to retake the Senate
- Milwaukee election leader ousted 6 months before election in presidential swing state
- Former President Trump calls for arrest of special prosecutor Jack Smith
- Wisconsin judge dismisses lawsuit challenging state’s new wolf management plan
- Wisconsin Supreme Court issues opinion on Milwaukee Police officer fired over Facebook posts
- Gov. Evers Seeks applicants for Menominee County Register of Deeds
WLJ People
- Power 30 Personal Injury Attorneys – Russell Nicolet
- Power 30 Personal Injury Attorneys – Benjamin Nicolet
- Power 30 Personal Injury Attorneys – Dustin T. Woehl
- Power 30 Personal Injury Attorneys – Katherine Metzger
- Power 30 Personal Injury Attorneys – Joseph Ryan
- Power 30 Personal Injury Attorneys – James M. Ryan
- Power 30 Personal Injury Attorneys – Dana Wachs
- Power 30 Personal Injury Attorneys – Mark L. Thomsen
- Power 30 Personal Injury Attorneys – Matthew Lein
- Power 30 Personal Injury Attorneys – Jeffrey A. Pitman
- Power 30 Personal Injury Attorneys – William Pemberton
- Power 30 Personal Injury Attorneys – Howard S. Sicula